State Planner

Florida · November 12, 2026

New Housing Units Permitted per 1,000 Residents, 2020–2025

This is a real answer State Planner produced from Florida’s public data.

Ask this question, or one like it, in State Planner now. Sign up to try every feature free for 7 days, no card needed, and the question will be waiting in your new chat to change or send.

Ask this in State Planner →
  1. Which Florida counties issued the most building permits for new homes from 2020 to 2025, and per 1,000 residents?


    From 2020 through 2025, building permits in Florida authorized 1,132,940 new privately owned housing units. These are the Census Bureau's Building Permits Survey estimates, with the Bureau's fill-in for permit offices that didn't report. I counted housing units, not permits or buildings. One permit for an apartment building can cover hundreds of units.

    To get the rate, I divided each county's six-year total by its July 1, 2025 population estimate from the Census Bureau. Counting both ways, Lee County ranks high: it permitted the most units of any county and has the 9th-highest rate.
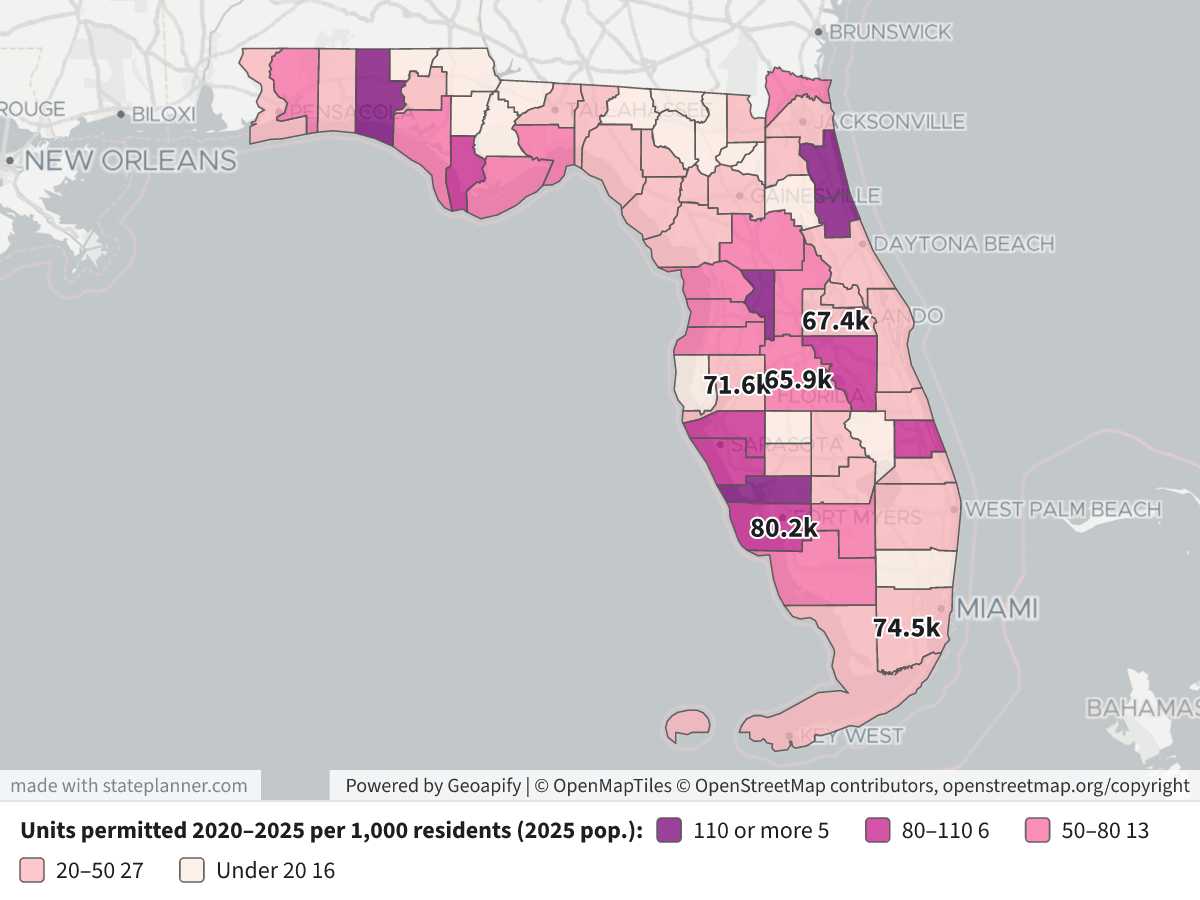
    New Housing Units Permitted per 1,000 Residents, 2020–2025New Housing Units Permitted per 1,000 Residents, 2020–2025⬇ Image

    Map legend: Each county is shaded by the number of units permitted from 2020 to 2025 for every 1,000 residents in 2025. The darkest purple is 110 or more, then 80–110, 50–80 and 20–50, and the palest is under 20. The labels show the totals for the five counties with the most units (k = thousand units). Click a county to see its total, its single-family and multifamily units, and its population.

    Most housing units permitted, 2020–2025

    RankCountyUnitsSingle-familyIn 2+ unit buildingsPer 1,000 residents
    1Lee80,20256,16324,03991.6
    2Miami-Dade74,45313,41161,04226.6
    3Hillsborough71,58136,12835,45345.5
    4Orange67,39027,65539,73544.1
    5Polk65,90751,59214,31575.3
    6Duval53,04630,75422,29249.9
    7Manatee48,22135,22312,998103.0
    8Osceola47,66834,43913,22999.0
    9Pasco44,34640,3473,99965.7
    10Sarasota41,48028,98412,49686.4

    Most housing units permitted per 1,000 residents, 2020–2025

    RankCountyUnitsPer 1,000 residents (2025)Yearly average per 1,000
    1Walton15,027161.129.5
    2Sumter23,564149.427.0
    3Charlotte25,468117.220.8
    4Flagler15,821112.720.5
    5St. Johns38,454111.020.5
    6Gulf1,716107.618.7
    7Manatee48,221103.018.4
    8Osceola47,66899.018.2
    9Lee80,20291.616.1
    10Sarasota41,48086.414.9

    The yearly average divides total units by the populations of all six years added together.

    What stands out

    • The largest totals are in big metro counties, but the kinds of housing differ. In Miami-Dade, 82% of permitted units are in buildings of two or more units, and Orange and Hillsborough are close to half and half. Lee, Polk and Pasco are mostly single-family.
    • The highest rates are in fast-growing coastal and retirement counties such as Walton, Sumter (home of The Villages), Charlotte, Flagler and St. Johns. Relative to their size, they permitted far more housing than the large metro counties.
    • The rates are lowest in Broward and Palm Beach, at 9.0 and 22.4 units per 1,000 residents, and in several small rural North Florida counties. Holmes (3.5) and Okeechobee (4.0) have the lowest rates in the state.

    Caveats

    • A permit allows construction to start. It doesn't mean the home was started or finished, and some permitted units are never built.
    • The survey leaves out manufactured (mobile) homes, public housing, and construction where no permit is required. Rural counties with many mobile homes may look lower than their actual housing growth.
    • Population figures are Census estimates (2025 vintage), not counts.

    If you meant something other than units, I can rank counties by the number of buildings, or by construction value (dollars as written on the permit, not adjusted for inflation).

Layers

  • …
    • …
    • …
    • …
    • …
    • …

Click anything on the map for its details.

The transcript below the answer shows every query it ran. Shapefiles of every layer, at full detail, can be downloaded in State Planner: sign up to ask your own question and export any map.

Ask your own question about Florida

Send takes you to sign up (every feature free for 7 days, no card needed), or to sign in if you have an account. Your question will be waiting in your new chat.

Transcript

What follows is the transcript of this chat as State Planner generated it. It is here to show how the answer above was arrived at: every query State Planner ran, what each one returned, and where the data came from.

transcript.md

↑ Contents

State Planner chat · https://stateplanner.com

  • State: Florida (FL)
  • Started: November 12, 2026, 5:51 PM UTC
  • Runtime: 38 sec
  • Status: completed
Prompt

Which Florida counties issued the most building permits for new homes from 2020 to 2025, and per 1,000 residents?

Model: Anthropic: Claude Opus 5.5 (anthropic/claude-opus-5.5, via openrouter)

Response

From 2020 through 2025, building permits in Florida authorized 1,132,940 new privately owned housing units. These are the Census Bureau's Building Permits Survey estimates, with the Bureau's fill-in for permit offices that didn't report. I counted housing units, not permits or buildings. One permit for an apartment building can cover hundreds of units.

To get the rate, I divided each county's six-year total by its July 1, 2025 population estimate from the Census Bureau. Counting both ways, Lee County ranks high: it permitted the most units of any county and has the 9th-highest rate.

New Housing Units Permitted per 1,000 Residents, 2020–2025

Map legend: Each county is shaded by the number of units permitted from 2020 to 2025 for every 1,000 residents in 2025. The darkest purple is 110 or more, then 80–110, 50–80 and 20–50, and the palest is under 20. The labels show the totals for the five counties with the most units (k = thousand units). Click a county to see its total, its single-family and multifamily units, and its population.

Most housing units permitted, 2020–2025

RankCountyUnitsSingle-familyIn 2+ unit buildingsPer 1,000 residents
1Lee80,20256,16324,03991.6
2Miami-Dade74,45313,41161,04226.6
3Hillsborough71,58136,12835,45345.5
4Orange67,39027,65539,73544.1
5Polk65,90751,59214,31575.3
6Duval53,04630,75422,29249.9
7Manatee48,22135,22312,998103.0
8Osceola47,66834,43913,22999.0
9Pasco44,34640,3473,99965.7
10Sarasota41,48028,98412,49686.4

Most housing units permitted per 1,000 residents, 2020–2025

RankCountyUnitsPer 1,000 residents (2025)Yearly average per 1,000
1Walton15,027161.129.5
2Sumter23,564149.427.0
3Charlotte25,468117.220.8
4Flagler15,821112.720.5
5St. Johns38,454111.020.5
6Gulf1,716107.618.7
7Manatee48,221103.018.4
8Osceola47,66899.018.2
9Lee80,20291.616.1
10Sarasota41,48086.414.9

The yearly average divides total units by the populations of all six years added together.

What stands out

  • The largest totals are in big metro counties, but the kinds of housing differ. In Miami-Dade, 82% of permitted units are in buildings of two or more units, and Orange and Hillsborough are close to half and half. Lee, Polk and Pasco are mostly single-family.
  • The highest rates are in fast-growing coastal and retirement counties such as Walton, Sumter (home of The Villages), Charlotte, Flagler and St. Johns. Relative to their size, they permitted far more housing than the large metro counties.
  • The rates are lowest in Broward and Palm Beach, at 9.0 and 22.4 units per 1,000 residents, and in several small rural North Florida counties. Holmes (3.5) and Okeechobee (4.0) have the lowest rates in the state.

Caveats

  • A permit allows construction to start. It doesn't mean the home was started or finished, and some permitted units are never built.
  • The survey leaves out manufactured (mobile) homes, public housing, and construction where no permit is required. Rural counties with many mobile homes may look lower than their actual housing growth.
  • Population figures are Census estimates (2025 vintage), not counts.

If you meant something other than units, I can rank counties by the number of buildings, or by construction value (dollars as written on the permit, not adjusted for inflation).

Exploratory Queries
Query 1 — Check which years of permits and population are available.
   SELECT (
             SELECT max(YEAR)
               FROM fl_bps_county_permits
          ) bps_max,
          (
             SELECT count(*)
               FROM fl_bps_county_permits
              WHERE YEAR BETWEEN 2020 AND 2025
          ) n,
          (
             SELECT max(YEAR)
               FROM fl_census_county_pop_est
          ) pop_max,
          (
             SELECT sum(units_total)
               FROM fl_bps_county_permits
              WHERE YEAR BETWEEN 2020 AND 2025
          ) units
bps_maxnpop_maxunits
202540220251132940

data/turn-1-query-1.csv

Query 2 — Total permitted units 2020–2025 per county with rates per 1,000 residents.
     WITH p AS (
             SELECT b.geoid,
                    sum(b.units_total) units,
                    sum(b.units_1) sf,
                    sum(b.units_2 + b.units_3_4 + b.units_5plus) mf,
                    sum(e.pop_estimate) popyrs,
                    max(e.pop_estimate) FILTER (
                        WHERE e.year = 2025
                    ) pop25,
                    max(e.pop_estimate) FILTER (
                        WHERE e.year = 2020
                    ) pop20
               FROM fl_bps_county_permits b
               JOIN fl_census_county_pop_est e ON e.geoid = b.geoid
                AND e.year = b.year
              WHERE b.year BETWEEN 2020 AND 2025
           GROUP BY b.geoid
          )
   SELECT c.name,
          units,
          sf,
          mf,
          pop25,
          round(1000.0 * units / pop25, 1) per1k_2025pop,
          round(1000.0 * units / popyrs, 1) annual_per1k,
          rank() OVER (
           ORDER BY units DESC
          ) rk_units,
          rank() OVER (
           ORDER BY units::numeric / pop25 DESC
          ) rk_rate
     FROM p
     JOIN fl_census_counties c ON c.geoid = p.geoid
 ORDER BY units DESC
nameunitssfmfpop25per1k_2025popannual_per1krk_unitsrk_rate
Lee County80202561632403987560791.616.119
Miami-Dade County744531341161042280202926.64.5245
Hillsborough County715813612835453157411545.57.8329
Orange County673902765539735152800244.17.6430
Polk County65907515921431587479075.313.7514
Duval County530463075422292106296349.98.6625
Manatee County482213522312998468200103.018.477
Osceola County47668344391322948171899.018.288
Pasco County4434640347399967451665.711.9919
Sarasota County41480289841249647995886.414.91010
St. Johns County38454308917563346328111.020.5115
Palm Beach County352492047014779157572622.43.81249
Marion County3445631253320344266077.814.11312
St. Lucie County3269527755494040244981.214.81411
Brevard County3093524195674066398246.68.11527
Lake County3047827282319645606866.812.11618
Collier County2663418489814541713163.911.01721
Volusia County2606719439662860657343.07.41831
Charlotte County25468204115057217212117.220.8193
Sumter County23564208492715157772149.427.0202
Broward County1821564241179120133179.01.52164
Pinellas County1700268851011794856317.93.02253
Flagler County15821131152706140360112.720.5234
Seminole County156596586907349188431.85.42439
Walton County150279788523993288161.129.5251

25 out of 67 are listed here.

data/turn-1-query-2.csv

Map Layer Queries
Units permitted 2020–2025 per 1,000 residents (2025 pop.) — colored by "cls": 110 or more (#7a0177), 80–110 (#c51b8a), 50–80 (#f768a1), 20–50 (#fbb4b9), Under 20 (#feebe2)
     WITH p AS (
             SELECT b.geoid,
                    sum(b.units_total) units,
                    sum(b.units_1) sf,
                    sum(b.units_2 + b.units_3_4 + b.units_5plus) mf,
                    max(e.pop_estimate) FILTER (
                        WHERE e.year = 2025
                    ) pop25
               FROM fl_bps_county_permits b
               JOIN fl_census_county_pop_est e ON e.geoid = b.geoid
                AND e.year = b.year
              WHERE b.year BETWEEN 2020 AND 2025
           GROUP BY b.geoid
          )
   SELECT c.geom,
          c.name AS "County",
          p.units AS "Units permitted 2020–2025",
          p.sf AS "Single-family units",
          p.mf AS "Units in 2+ unit buildings",
          p.pop25 AS "Population 2025",
          round(1000.0 * p.units / p.pop25, 1) AS "Units per 1,000 residents",
          CASE
                    WHEN 1000.0 * p.units / p.pop25 >= 110 THEN 'a'
                    WHEN 1000.0 * p.units / p.pop25 >= 80 THEN 'b'
                    WHEN 1000.0 * p.units / p.pop25 >= 50 THEN 'c'
                    WHEN 1000.0 * p.units / p.pop25 >= 20 THEN 'd'
                    ELSE 'e'
          END AS cls
     FROM p
     JOIN fl_census_counties c ON c.geoid = p.geoid

Picture: maps/turn-1-permits-per-1000-residents.png

Used Data Sets

data/turn-1-query-1.csv

↑ Contents
bps_maxnpop_maxunits
202540220251132940

1 row.

data/turn-1-query-2.csv

↑ Contents
nameunitssfmfpop25per1k_2025popannual_per1krk_unitsrk_rate
Lee County80202561632403987560791.616.119
Miami-Dade County744531341161042280202926.64.5245
Hillsborough County715813612835453157411545.57.8329
Orange County673902765539735152800244.17.6430
Polk County65907515921431587479075.313.7514
Duval County530463075422292106296349.98.6625
Manatee County482213522312998468200103.018.477
Osceola County47668344391322948171899.018.288
Pasco County4434640347399967451665.711.9919
Sarasota County41480289841249647995886.414.91010
St. Johns County38454308917563346328111.020.5115
Palm Beach County352492047014779157572622.43.81249
Marion County3445631253320344266077.814.11312
St. Lucie County3269527755494040244981.214.81411
Brevard County3093524195674066398246.68.11527
Lake County3047827282319645606866.812.11618
Collier County2663418489814541713163.911.01721
Volusia County2606719439662860657343.07.41831
Charlotte County25468204115057217212117.220.8193
Sumter County23564208492715157772149.427.0202
Broward County1821564241179120133179.01.52164
Pinellas County1700268851011794856317.93.02253
Flagler County15821131152706140360112.720.5234
Seminole County156596586907349188431.85.42439
Walton County150279788523993288161.129.5251
Bay County1461110320429120447971.512.82616
Alachua County134155355806029002846.37.82728
Leon County122684580768829904841.06.92832
Santa Rosa County114881133015821111554.49.52922
Clay County113789393198523959347.58.33026
Hernando County113019364193722170151.09.03123
Citrus County112851116212317166665.711.53220
Escambia County100688606146233383430.25.13342
Okaloosa County89456637230822181040.36.93433
Nassau County8284739189310687977.513.93513
Indian River County6402553986317279937.06.43637
Martin County52553353190216627231.65.43740
Highlands County4151376938211112237.46.53835
Hendry County334231651774827669.212.83917
Wakulla County2840284003808974.613.24015
Monroe County251916328878040631.35.14141
Gulf County17161714215943107.618.7426
Levy County1392138664852028.75.14344
Columbia County12051189167409416.32.84456
DeSoto County8726522203707823.54.14548
Washington County87187102669532.65.64638
Gilchrist County81581502048839.87.14734
Suwannee County796752444814916.52.94855
Putnam County779743367773410.01.74962
Baker County7686541142973725.84.55047
Jackson County7556381174962915.22.65159
Gadsden County6784841944429815.32.65258
Franklin County65765701302950.48.75324
Hardee County496440562593219.13.25452
Glades County494484101327037.26.55536
Bradford County47247022830716.72.85654
Jefferson County46146101600728.85.05743
Taylor County4342661682121020.53.45851
Dixie County375315601803820.83.65950
Union County26426401625016.22.86057
Madison County24724521875913.22.26160
Lafayette County2322320879226.44.76246
Okeechobee County16913138426084.00.76366
Hamilton County15115101418010.61.86461
Calhoun County1291290132899.71.66563
Liberty County7171080358.81.56665
Holmes County71710201193.50.66667

67 rows.

provenance/fl_bps_county_permits.md

↑ Contents

Provenance: fl_bps_county_permits

This file describes how the rows in PostgreSQL table fl_bps_county_permits were obtained from an external source: where they were fetched and how fields were renamed and typed. Field meanings are in the mapping table below.

Identity
  • Table: fl_bps_county_permits
  • Family: BPS
  • Display name: Building Permits by County
  • Source URL: https://www2.census.gov/econ/bps/County/ (co<year>a.txt, 1990 on)
  • Geometry (source / stored): none / none
  • Update cycle: Yearly (each May)
Pipeline

The Building Permits Survey publishes one national county file per year, the annual summary (a), comma-delimited text with a two-row header. Every year from 1990 is loaded; the newest year is the one before the current, once the Bureau has published it. Each year's file is downloaded whole and kept; the sync keeps Florida's rows (FIPS State 12) and checks each file's survey date names its year (2024, or 9099 in the 1990s files).

A county listed twice in one year (the 2014 and 2015 files repeat four Alaska boroughs and one Maryland county under a second name with the same estimates) keeps the row with more reported units; two rows with different estimates fail the sync. The monthly and year-to-date files are not loaded.

Changed from the source: cut to Florida; reshaped to one row per county per year; the three totals added; the region, division and survey-date columns dropped.

No licence terms: a work of the U.S. Government, credited to the U.S. Census Bureau.

Field → column mapping
Source fieldColumnTypeDescription
FIPS State, FIPS CountygeoidtextTwo digits and three, joined
County NamenametextTrailing spaces trimmed
Survey Dateyeartext → integerChecked against the file's year
1-unit Bldgs, Units, Valuebldgs_1, units_1, value_1integerEstimates with imputation
2-units Bldgs, Units, Valuebldgs_2, units_2, value_2integer
3-4 units Bldgs, Units, Valuebldgs_3_4, units_3_4, value_3_4integer
5+ units Bldgs, Units, Valuebldgs_5plus, units_5plus, value_5plusinteger
1-unit rep … 5+ units reprep_bldgs_1 … rep_value_5plusintegerReported only
(computed)bldgs_total, units_total, value_totalThe four estimate sizes added
Region Code, Division Code(dropped)

provenance/fl_census_counties.md

↑ Contents

Provenance: fl_census_counties

This file describes how the rows in PostgreSQL table fl_census_counties were obtained from an external source: where they were fetched and how fields were renamed and typed. Field meanings are in the mapping table below.

Identity
Pipeline

Two Census Bureau sources, joined on the county's 5-digit FIPS code:

  • Boundaries: TIGERweb tigerWMS_Current layer 82 ("Counties"), where=STATE='12', GeoJSON, outSR=4326, keyset-paged on GEOID.
  • CFS areas: sheet CFSAreas of the 2022 Commodity Flow Survey county list, the Florida rows (ST = 12). Only the 2022 columns are kept.

The two must name the same counties, or the sync fails. FAF's fl_faf_county_xwalk is built from this table: each county's cfs_geoid is the CFS22_ID of one FAF6 zone.

Field → column mapping
Source fieldColumnTypeDescription
TIGER GEOIDgeoidvarchar(5)state + county FIPS
TIGER GEOID, last 3county_fipsvarchar(3)county FIPS
TIGER NAMEnamevarchar(60)e.g. Miami-Dade County
CFS CFS22_AREAcfs_areavarchar(5)CSA/MSA code, or 99999
CFS CFS22_TYPEcfs_area_typevarchar(1)C, M or R
CFS CFS22_NAME, whitespace collapsedcfs_area_namevarchar(120)the workbook pads some names with doubled and trailing spaces
CFS CFS22_GEOIDcfs_geoidvarchar(19)e.g. E330000US1237000000
TIGER AREALANDaland_m2bigintsquare meters
TIGER AREAWATERawater_m2bigintsquare meters
TIGER INTPTLATintptlatdouble precisioninternal point
TIGER INTPTLONintptlondouble precisioninternal point
geometrygeomgeometry(MultiPolygon, 4326)ST_Multi(ST_GeomFromGeoJSON)
Geometry
  • SRID 4326 (WGS84). GIST index on geom.
Change detection

The Census sync's check compares the layer's vintage ("January 1, 2026 vintage") and Florida's row count, and the county list's Last-Modified and length. A change to either marks Census stale, and the next Census sync rebuilds this table, then FAF's crosswalk.

Attribution

US Census Bureau. TIGER products are free to use with acknowledgement of the U.S. Census Bureau as the source; the CFS county list states no terms.

provenance/fl_census_county_pop_est.md

↑ Contents

Provenance: fl_census_county_pop_est

This file describes how the rows in PostgreSQL table fl_census_county_pop_est were obtained from an external source: where they were fetched and how fields were renamed and typed. Field meanings are in the mapping table below.

Identity
  • Table: fl_census_county_pop_est
  • Family: Census
  • Display name: Annual Population Estimates by County
  • Source URL: https://www2.census.gov/programs-surveys/popest/datasets/2020-2025/counties/totals/co-est2025-alldata.csv (vintage 2025; each vintage <V> is 2020-<V>/counties/totals/co-est<V>-alldata.csv), for 2020 on
  • History (2000–2019): under the same datasets/ directory, 2000-2010/intercensal/county/co-est00int-tot.csv and 2010-2020/intercensal/county/asrh/cc-est2020int-agesex-all.csv (the revised population), 2010/2010-eval-estimates/co-est2010-alldata.csv and 2010-2020/counties/totals/co-est2020-alldata.csv (the components of change of the releases they revised)
  • History (1970–1999): under https://www2.census.gov/programs-surveys/popest/tables/, 1900-1980/counties/asrh/co-asr-7079.csv, 1980-1990/counties/asrh/pe-02-<year>.csv and 1990-2000/intercensal/st-co/stch-icen<year>.txt (the county age, sex and race estimates), and 1900-1980/counties/totals/e7079co.txt and 1980-1990/counties/totals/e8089co.txt (the decades' county totals tables, for their census counts)
  • Geometry (source / stored): none / none
  • Update cycle: Yearly (each March)
Pipeline

The Population Estimates Program's national county file, CSV, one row per county with a column per year for each figure. The sync keeps Florida's county rows (SUMLEV 050, STATE 12), dropping the state's own total (040), and turns each into one row per year, the years read off the file's POPESTIMATE<year> columns. Every county the file names must be one the county layer of TIGERweb draws, or the sync fails. A file that is not valid UTF-8 is read as Latin-1. These rows are series postcensal.

The years before 2020 are series intercensal, from four further national files that never change:

  • Population, 2000–2009: co-est00int-tot.csv, one row per county, codes written without leading zeros (SUMLEV "50", STATE "1"), which the sync pads. ESTIMATESBASE2000 and POPESTIMATE2000–2009; its POPESTIMATE2010 and CENSUS2010POP are not loaded. vintage 2010.
  • Population, 2010–2019: the Bureau's table of revised county totals for the decade is a spreadsheet that names counties without codes, so the sync reads the same figures from cc-est2020int-agesex-all.csv, one row per county and YEAR code, its POPESTIMATE the whole population: YEAR 1 is the April 1, 2010 base, 2–11 July 1, 2010–2019, and 12 (the April 1, 2020 census) is not loaded. vintage 2020. 2010 is taken from this file, not the 2000s one, which has its own figure for it.
  • Components: the original releases' files, as published, matched by county code: co-est2010-alldata.csv for 2000–2010 (2000 is April to June) and co-est2020-alldata.csv for 2011–2019. Their natural change column is NATURALINC<year>. A county with no row in the 2000s release (one coded anew in the 2010s) has empty 2010 components; any other missing county fails the sync.
  • pop_change is computed, not read: pop_estimate less the row before's (2010's less the 2000s file's 2009, 2000's less 1999's, or ESTIMATESBASE2000 for a county with no 1999 row). The releases' NPOPCHG_<year> describes their own population, not the revised one, and is not loaded.
  • 1970–1999: each county's July 1 population is the sum of its age, sex and race estimates, which fl_census_county_pop_char loads from the same files (its provenance has their layouts): vintage 1980, 1990 and 2000 for the three decades. The Bureau's county totals tables for the 1970s and 1980s, e7079co.txt and e8089co.txt, are fixed-width text in blocks of five years, a long name wrapping onto a line of its own; only their first column, the decade's April 1 census, is loaded, into estimates_base on the 1970 and 1980 rows. Their July figures are not loaded: the 1970s table rounds counties to hundreds, and both are on the geography of their day as the age files are, but not always the same day's. No component of change is loaded before 2000. pop_change is computed as for the later decades, 1970's from the April 1970 count, and the 2000 row's is from July 1999.
  • A history row's county need not be one TIGER draws today (Connecticut's eight old counties, the 1970s' Alaskan census divisions and Virginia's Nansemond, and a handful elsewhere); the sync logs them.
Field → column mapping
Source fieldColumnTypeDescription
STATE + COUNTYgeoidvarchar(5)county FIPS
the <year> suffixyearsmallint
the newest <year>vintagesmallint1980, 1990, 2000, 2010 or 2020 on history rows
seriesvarchar(12)postcensal, or intercensal on history rows
POPESTIMATE<year>pop_estimateinteger
ESTIMATESBASE2020estimates_baseinteger2020 row only (ESTIMATESBASE2000, YEAR 1 on the 2000 and 2010 rows; the decade tables' census column on the 1970 and 1980 rows)
NPOPCHG<year>pop_changeintegercomputed on history rows
BIRTHS<year>birthsinteger
DEATHS<year>deathsinteger
NATURALCHG<year>natural_changeintegerNATURALINC<year> on history rows
INTERNATIONALMIG<year>international_miginteger
DOMESTICMIG<year>domestic_miginteger
NETMIG<year>net_miginteger
RESIDUAL<year>residualinteger
GQESTIMATES<year>gq_estimateinteger

The file's per-1,000 rate columns (R…) and GQESTIMATESBASE2020 are not loaded.

Geometry
  • No geometry column.
Change detection

The Census sync's check asks for the next vintage's file each time and moves to it once it is published; otherwise it compares the current file's Last-Modified and length, and each history file's. Any of them marks this table stale, and the next Census sync rebuilds it whole, every year from 2020 replaced by the new release.

Attribution

US Census Bureau, Population Estimates Program.

© 2026 State Planner