State Planner

Florida · November 11, 2026

Real GDP Growth by County, 2017–2022

This is a real answer State Planner produced from Florida’s public data.

Ask this question, or one like it, in State Planner now. Sign up to try every feature free for 7 days, no card needed, and the question will be waiting in your new chat to change or send.

Ask this in State Planner →
  1. Which Florida counties’ economies grew fastest from 2017 to 2022, after adjusting for inflation? Map the change.


    Real GDP growth by Florida county, 2017 to 2022

    I measured growth with BEA's real GDP for all industries combined, in chained 2017 dollars. BEA builds this figure to remove inflation, so no hand adjustment is needed. Florida's own BEA figure grew 22.8%, from about $1.01 trillion to $1.25 trillion. BEA published figures for all 67 counties, with none withheld.
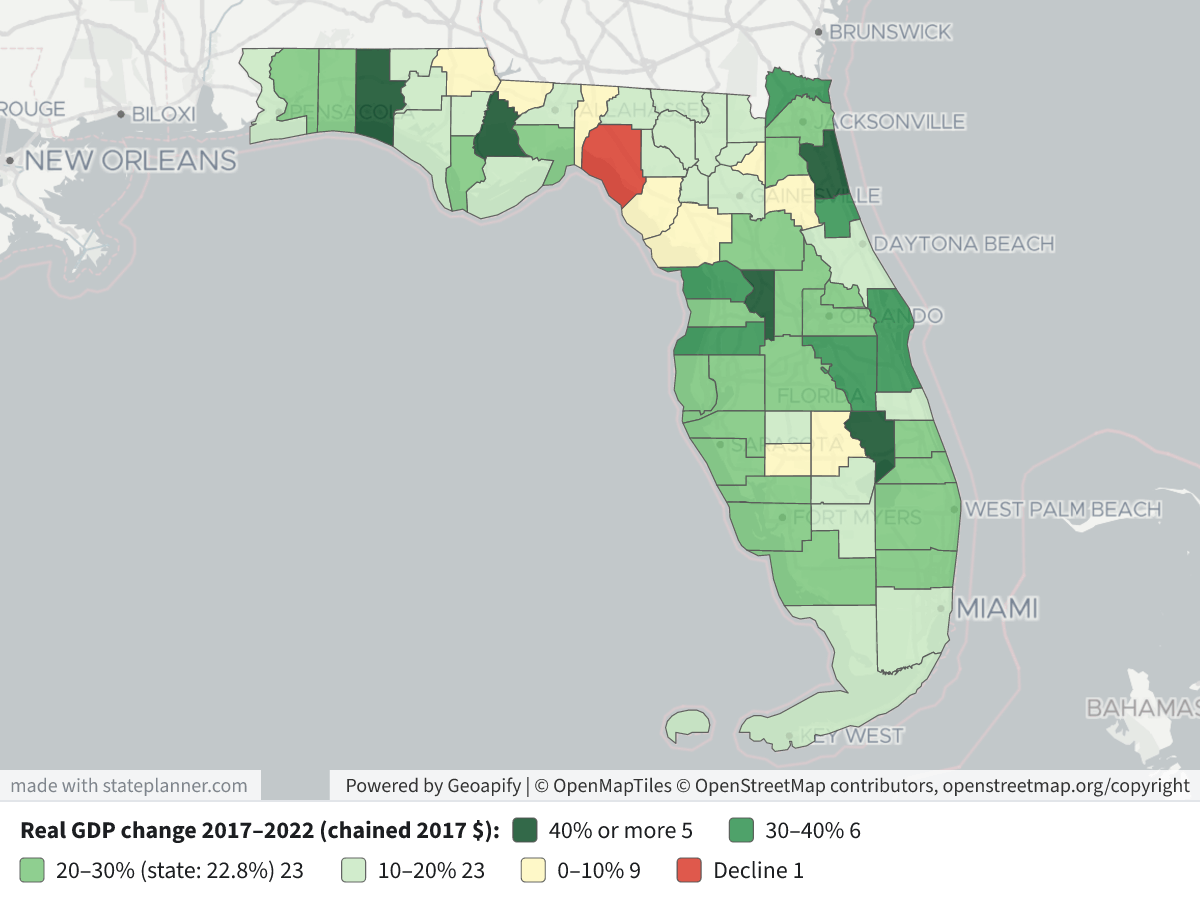
    Real GDP Growth by County, 2017–2022Real GDP Growth by County, 2017–2022⬇ Image

    Legend: darker green means faster real growth. The darkest green is 40% or more, then 30–40%, 20–30% (the band that holds the state's 22.8%), 10–20%, and pale yellow for 0–10%. Red marks the one county whose real GDP fell. Click a county to see its 2017 and 2022 real GDP and the percent change.

    Fastest-growing counties, real GDP 2017–2022 (millions of chained 2017 $)

    RankCounty20172022Change
    1Sumter3,2085,085+58.5%
    2Okeechobee1,2541,874+49.5%
    3Liberty183263+43.7%
    4Walton3,0734,396+43.1%
    5St. Johns8,97112,811+42.8%
    6Flagler2,6953,694+37.0%
    7Nassau2,6473,518+32.9%
    8Pasco12,59716,683+32.4%
    9Citrus3,7044,903+32.4%
    10Brevard24,13331,677+31.3%

    What the map shows

    • The fastest growth is on the edges of the big metros. Around Jacksonville: St. Johns, Nassau and Flagler. North of Tampa: Pasco, Citrus and Hernando. Around Orlando and The Villages: Sumter, Osceola and Lake. On the Space Coast: Brevard. On the Emerald Coast: Walton, Okaloosa and Santa Rosa.
    • The large urban counties grew close to the state rate. Hillsborough grew 26.8%, Palm Beach 24.0%, Duval 23.3%, Orange 22.1% and Broward 22.0%. Miami-Dade grew more slowly, at 17.6%.
    • Liberty (+43.7%) and Okeechobee (+49.5%) are small economies. Their percentages are large, but the dollar gains behind them are small.
    • The slowest growth was in rural North Florida and parts of the interior. Taylor is the only county where real GDP fell (−7.8%). Gadsden (+1.1%), Dixie (+1.4%), Bradford (+2.5%) and Jackson (+4.3%) grew the least.

    Caveats

    • These are BEA's latest revised figures. Chained dollars should only be compared over time within one county, not added across counties.
    • The 2017–2022 window includes the 2020 downturn and the recovery after it, so a county's growth depends partly on how hard 2020 hit it.
    • GDP measures output where it is produced, not residents' income. Per-capita income growth (from fl_bea_county_income) could rank the counties differently.

Layers

  • …
    • …
    • …
    • …
    • …
    • …
    • …

Click anything on the map for its details.

The transcript below the answer shows every query it ran. Shapefiles of every layer, at full detail, can be downloaded in State Planner: sign up to ask your own question and export any map.

Ask your own question about Florida

Send takes you to sign up (every feature free for 7 days, no card needed), or to sign in if you have an account. Your question will be waiting in your new chat.

Transcript

What follows is the transcript of this chat as State Planner generated it. It is here to show how the answer above was arrived at: every query State Planner ran, what each one returned, and where the data came from.

transcript.md

↑ Contents

State Planner chat · https://stateplanner.com

  • State: Florida (FL)
  • Started: November 11, 2026, 2:53 PM UTC
  • Runtime: 28 sec
  • Status: completed
Prompt

Which Florida counties’ economies grew fastest from 2017 to 2022, after adjusting for inflation? Map the change.

Model: Anthropic: Claude Opus 5.5 (anthropic/claude-opus-5.5, via openrouter)

Response

Real GDP growth by Florida county, 2017 to 2022

I measured growth with BEA's real GDP for all industries combined, in chained 2017 dollars. BEA builds this figure to remove inflation, so no hand adjustment is needed. Florida's own BEA figure grew 22.8%, from about $1.01 trillion to $1.25 trillion. BEA published figures for all 67 counties, with none withheld.

Real GDP Growth by County, 2017–2022

Legend: darker green means faster real growth. The darkest green is 40% or more, then 30–40%, 20–30% (the band that holds the state's 22.8%), 10–20%, and pale yellow for 0–10%. Red marks the one county whose real GDP fell. Click a county to see its 2017 and 2022 real GDP and the percent change.

Fastest-growing counties, real GDP 2017–2022 (millions of chained 2017 $)

RankCounty20172022Change
1Sumter3,2085,085+58.5%
2Okeechobee1,2541,874+49.5%
3Liberty183263+43.7%
4Walton3,0734,396+43.1%
5St. Johns8,97112,811+42.8%
6Flagler2,6953,694+37.0%
7Nassau2,6473,518+32.9%
8Pasco12,59716,683+32.4%
9Citrus3,7044,903+32.4%
10Brevard24,13331,677+31.3%

What the map shows

  • The fastest growth is on the edges of the big metros. Around Jacksonville: St. Johns, Nassau and Flagler. North of Tampa: Pasco, Citrus and Hernando. Around Orlando and The Villages: Sumter, Osceola and Lake. On the Space Coast: Brevard. On the Emerald Coast: Walton, Okaloosa and Santa Rosa.
  • The large urban counties grew close to the state rate. Hillsborough grew 26.8%, Palm Beach 24.0%, Duval 23.3%, Orange 22.1% and Broward 22.0%. Miami-Dade grew more slowly, at 17.6%.
  • Liberty (+43.7%) and Okeechobee (+49.5%) are small economies. Their percentages are large, but the dollar gains behind them are small.
  • The slowest growth was in rural North Florida and parts of the interior. Taylor is the only county where real GDP fell (−7.8%). Gadsden (+1.1%), Dixie (+1.4%), Bradford (+2.5%) and Jackson (+4.3%) grew the least.

Caveats

  • These are BEA's latest revised figures. Chained dollars should only be compared over time within one county, not added across counties.
  • The 2017–2022 window includes the 2020 downturn and the recovery after it, so a county's growth depends partly on how hard 2020 hit it.
  • GDP measures output where it is produced, not residents' income. Per-capita income growth (from fl_bea_county_income) could rank the counties differently.
Exploratory Queries
Query 1 — Compute real GDP change 2017-2022 by county.
   SELECT a.geoid,
          a.name,
          round(a.real_gdp / 1e6, 2) rgdp17_bn,
          round(b.real_gdp / 1e6, 2) rgdp22_bn,
          round(100 * (b.real_gdp / a.real_gdp -1), 1) pct,
          b.codes,
          (c.geoid IS NOT NULL) in_census
     FROM fl_bea_county_gdp a
     JOIN fl_bea_county_gdp b ON a.geoid = b.geoid
      AND b.line_code = 1
      AND b.year = 2022
LEFT JOIN fl_census_counties c ON c.geoid = a.geoid
    WHERE a.line_code = 1
      AND a.year = 2017
 ORDER BY pct DESC
geoidnamergdp17_bnrgdp22_bnpctcodesin_census
12119Sumter, FL3208.205085.2758.5true
12093Okeechobee, FL1253.571873.7949.5true
12077Liberty, FL183.22263.2943.7true
12131Walton, FL3072.674395.8643.1true
12109St. Johns, FL8970.7212810.5042.8true
12035Flagler, FL2695.383693.5837.0true
12089Nassau, FL2646.893518.3032.9true
12101Pasco, FL12596.6316682.8932.4true
12017Citrus, FL3704.394902.9532.4true
12009Brevard, FL24133.0631676.9231.3true
12097Osceola, FL10505.7713744.8230.8true
12021Collier, FL18972.2224257.7927.9true
12081Manatee, FL14216.8918164.1227.8true
12091Okaloosa, FL11313.0914458.1127.8true
12113Santa Rosa, FL4429.465625.5127.0true
12057Hillsborough, FL87528.49111012.3826.8true
12111St. Lucie, FL9305.4211773.4726.5true
12115Sarasota, FL20195.0225555.5926.5true
12053Hernando, FL4036.625088.8826.1true
12015Charlotte, FL5181.246512.0525.7true
12117Seminole, FL20979.5126183.2424.8true
12071Lee, FL31283.5338894.7224.3true
12069Lake, FL9661.0111988.7824.1true
12099Palm Beach, FL82713.43102539.9924.0true
12083Marion, FL9763.7212089.3423.8true

25 out of 68 are listed here.

data/turn-1-query-1.csv

Map Layer Queries
Real GDP change 2017–2022 (chained 2017 $) — colored by "cls": 40% or more (#00441b), 30–40% (#238b45), 20–30% (state: 22.8%) (#74c476), 10–20% (#c7e9c0), 0–10% (#fff7bc), Decline (#d7301f)
   SELECT c.geom,
          c.name AS "County",
          round(a.real_gdp / 1e6) AS "Real GDP 2017 ($M, 2017 $)",
          round(b.real_gdp / 1e6) AS "Real GDP 2022 ($M, 2017 $)",
          round(100 * (b.real_gdp / a.real_gdp -1), 1) AS "Change(%)",
          CASE
                    WHEN b.real_gdp / a.real_gdp -1 >= 0.40 THEN '40%+'
                    WHEN b.real_gdp / a.real_gdp -1 >= 0.30 THEN '30-40%'
                    WHEN b.real_gdp / a.real_gdp -1 >= 0.20 THEN '20-30%'
                    WHEN b.real_gdp / a.real_gdp -1 >= 0.10 THEN '10-20%'
                    WHEN b.real_gdp / a.real_gdp -1 >= 0 THEN '0-10%'
                    ELSE 'Decline'
          END AS cls
     FROM fl_census_counties c
     JOIN fl_bea_county_gdp a ON a.geoid = c.geoid
      AND a.line_code = 1
      AND a.year = 2017
     JOIN fl_bea_county_gdp b ON b.geoid = c.geoid
      AND b.line_code = 1
      AND b.year = 2022

Picture: maps/turn-1-real-gdp-growth-county.png

Used Data Sets

data/turn-1-query-1.csv

↑ Contents
geoidnamergdp17_bnrgdp22_bnpctcodesin_census
12119Sumter, FL3208.205085.2758.5true
12093Okeechobee, FL1253.571873.7949.5true
12077Liberty, FL183.22263.2943.7true
12131Walton, FL3072.674395.8643.1true
12109St. Johns, FL8970.7212810.5042.8true
12035Flagler, FL2695.383693.5837.0true
12089Nassau, FL2646.893518.3032.9true
12101Pasco, FL12596.6316682.8932.4true
12017Citrus, FL3704.394902.9532.4true
12009Brevard, FL24133.0631676.9231.3true
12097Osceola, FL10505.7713744.8230.8true
12021Collier, FL18972.2224257.7927.9true
12081Manatee, FL14216.8918164.1227.8true
12091Okaloosa, FL11313.0914458.1127.8true
12113Santa Rosa, FL4429.465625.5127.0true
12057Hillsborough, FL87528.49111012.3826.8true
12111St. Lucie, FL9305.4211773.4726.5true
12115Sarasota, FL20195.0225555.5926.5true
12053Hernando, FL4036.625088.8826.1true
12015Charlotte, FL5181.246512.0525.7true
12117Seminole, FL20979.5126183.2424.8true
12071Lee, FL31283.5338894.7224.3true
12069Lake, FL9661.0111988.7824.1true
12099Palm Beach, FL82713.43102539.9924.0true
12083Marion, FL9763.7212089.3423.8true
12031Duval, FL62868.2177538.8423.3true
12045Gulf, FL387.08476.2423.0true
12000Florida1014866.861245927.5622.8false
12085Martin, FL7438.589116.9322.6true
12105Polk, FL25742.4931529.2422.5true
12095Orange, FL95077.00116081.6322.1true
12011Broward, FL104703.41127700.0822.0true
12103Pinellas, FL48499.2758605.2920.8true
12129Wakulla, FL705.27851.6020.7true
12019Clay, FL5191.436255.3320.5true
12087Monroe, FL4924.215879.9319.4true
12041Gilchrist, FL330.71394.6919.3true
12043Glades, FL277.23329.6818.9true
12049Hardee, FL1037.681231.5818.7true
12127Volusia, FL17886.6621194.6118.5true
12001Alachua, FL13230.6315670.8218.4true
12047Hamilton, FL472.19556.1117.8true
12059Holmes, FL349.94411.7117.7true
12086Miami-Dade, FL159539.07187545.7217.6true
12061Indian River, FL6355.427452.8817.3true
12005Bay, FL8391.389812.4716.9true
12079Madison, FL408.98477.8316.8true
12051Hendry, FL1192.861380.0215.7true
12037Franklin, FL337.90390.4515.6true
12133Washington, FL560.28646.8915.5true
12125Union, FL314.46363.0915.5true
12023Columbia, FL2136.952454.9014.9true
12073Leon, FL14927.9717144.7314.8true
12067Lafayette, FL150.81172.5114.4true
12013Calhoun, FL271.09309.0014.0true
12121Suwannee, FL1217.081373.2112.8true
12033Escambia, FL15781.4017684.4112.1true
12003Baker, FL664.45740.6011.5true
12065Jefferson, FL250.29274.499.7true
12055Highlands, FL2482.122704.889.0true
12027DeSoto, FL932.061010.098.4true
12107Putnam, FL2125.362280.287.3true
12075Levy, FL922.16985.426.9true
12063Jackson, FL1312.521369.074.3true
12007Bradford, FL654.60670.872.5true
12029Dixie, FL280.62284.481.4true
12039Gadsden, FL1225.491238.891.1true
12123Taylor, FL759.47700.39-7.8true

68 rows.

provenance/fl_bea_county_gdp.md

↑ Contents

Provenance: fl_bea_county_gdp

This file describes how the rows in PostgreSQL table fl_bea_county_gdp were obtained from an external source: where they were fetched and how fields were renamed and typed. Field meanings are in the mapping table below.

Identity
Pipeline

BEA publishes each regional table as one national zip holding a CSV per state (and one of every area). The BEA sync downloads each zip once into its input store, when a HEAD request shows BEA changed it, and every state reads its own CSV from the stored file.

Four tables are read from Florida's CSVs, one value column each: CAGDP2 (GDP in current dollars), CAGDP9 (real GDP), CAGDP8 (the chain-type quantity index) and CAGDP11 (contributions to the percent change in real GDP). They share their line numbers, so a row is one area, line and year with the four figures side by side. The line's description, NAICS codes and whether it is a total come from CAGDP2: a line is a total where the next line is indented below it, and lines 87–92, BEA's alternative groupings, are totals too.

Each cell is BEA's figure scaled from its unit (thousands of dollars) to dollars as exact decimal text, or, where BEA wrote a code in parentheses, a null with the code kept in codes; (NA) is a null with no code. The files are Latin-1. The stage checks the header, every unit and the table names it reads, counts the rows it expects, and dates the load by the "Last updated" line in the CSV's footer.

Changed from the source: cut to Florida; reshaped from one row per area and line with a column per year to one row per area, line and year with a column per table; figures converted to dollars; BEA's codes stored as nulls with the code beside them; footnote marks dropped from names and descriptions; the indent recorded as is_total.

Public domain; BEA asks to be cited as the source.

Field → column mapping
Source fieldColumnTypeDescription
GeoFIPSgeoidtextLeading space and quotes dropped
GeoNamenametextFootnote mark (*) dropped
LineCodeline_codesmallint
DescriptionindustrytextIndent and footnote marks dropped
IndustryClassificationnaicstext... stored as null
Region, TableName, Unit(dropped)TableName and Unit checked
2001 …yearsmallintOne row per year column
CAGDP2 cellsgdpnumericAs published, with thousands or millions of dollars scaled to dollars
CAGDP9 cellsreal_gdpnumericAs published, with thousands or millions of dollars scaled to dollars
CAGDP8 cellsquantity_indexnumericAs published, with thousands or millions of dollars scaled to dollars
CAGDP11 cellsreal_gdp_contributionnumericAs published, with thousands or millions of dollars scaled to dollars

provenance/fl_census_counties.md

↑ Contents

Provenance: fl_census_counties

This file describes how the rows in PostgreSQL table fl_census_counties were obtained from an external source: where they were fetched and how fields were renamed and typed. Field meanings are in the mapping table below.

Identity
Pipeline

Two Census Bureau sources, joined on the county's 5-digit FIPS code:

  • Boundaries: TIGERweb tigerWMS_Current layer 82 ("Counties"), where=STATE='12', GeoJSON, outSR=4326, keyset-paged on GEOID.
  • CFS areas: sheet CFSAreas of the 2022 Commodity Flow Survey county list, the Florida rows (ST = 12). Only the 2022 columns are kept.

The two must name the same counties, or the sync fails. FAF's fl_faf_county_xwalk is built from this table: each county's cfs_geoid is the CFS22_ID of one FAF6 zone.

Field → column mapping
Source fieldColumnTypeDescription
TIGER GEOIDgeoidvarchar(5)state + county FIPS
TIGER GEOID, last 3county_fipsvarchar(3)county FIPS
TIGER NAMEnamevarchar(60)e.g. Miami-Dade County
CFS CFS22_AREAcfs_areavarchar(5)CSA/MSA code, or 99999
CFS CFS22_TYPEcfs_area_typevarchar(1)C, M or R
CFS CFS22_NAME, whitespace collapsedcfs_area_namevarchar(120)the workbook pads some names with doubled and trailing spaces
CFS CFS22_GEOIDcfs_geoidvarchar(19)e.g. E330000US1237000000
TIGER AREALANDaland_m2bigintsquare meters
TIGER AREAWATERawater_m2bigintsquare meters
TIGER INTPTLATintptlatdouble precisioninternal point
TIGER INTPTLONintptlondouble precisioninternal point
geometrygeomgeometry(MultiPolygon, 4326)ST_Multi(ST_GeomFromGeoJSON)
Geometry
  • SRID 4326 (WGS84). GIST index on geom.
Change detection

The Census sync's check compares the layer's vintage ("January 1, 2026 vintage") and Florida's row count, and the county list's Last-Modified and length. A change to either marks Census stale, and the next Census sync rebuilds this table, then FAF's crosswalk.

Attribution

US Census Bureau. TIGER products are free to use with acknowledgement of the U.S. Census Bureau as the source; the CFS county list states no terms.

© 2026 State Planner