State Planner

Massachusetts · November 15, 2026

Census Blocks Within Half a Mile of Commuter Rail

This is a real answer State Planner produced from Massachusetts’s public data.

Ask this question, or one like it, in State Planner now. Sign up to try every feature free for 7 days, no card needed, and the question will be waiting in your new chat to change or send.

Ask this in State Planner →
  1. How many people and homes are within half a mile of each Massachusetts commuter rail station? Map the census blocks.


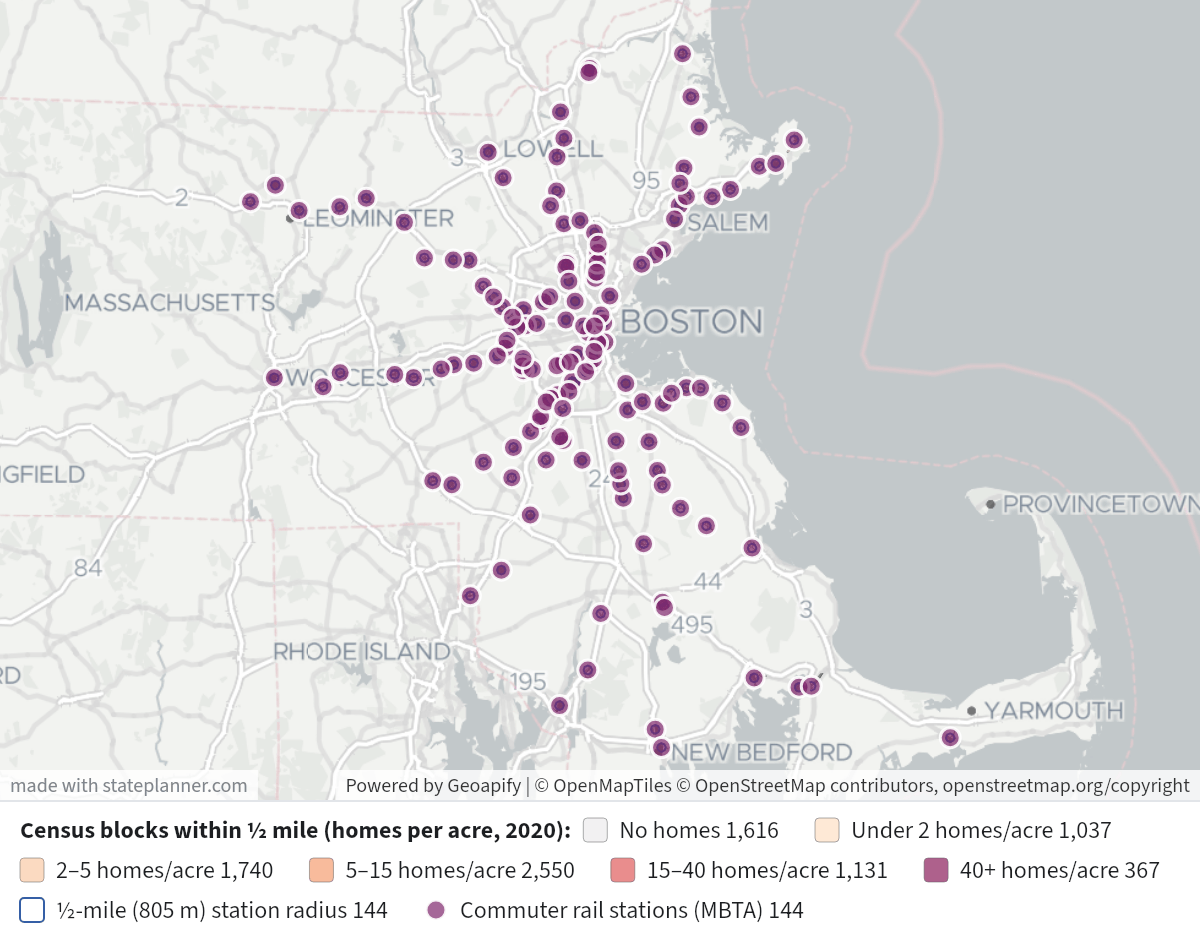
    About 699,000 people and 307,000 homes are within half a mile of at least one of Massachusetts's 144 MBTA commuter rail stations. That's roughly 10% of the state's 2020 population (7.03 million) and 10% of its housing units (3.0 million). The counts are from the 2020 census, by block, and are counted once even where two stations' circles overlap. Of those homes, 285,000 were occupied.
    Census Blocks Within Half a Mile of Commuter RailCensus Blocks Within Half a Mile of Commuter Rail⬇ Image

    Map legend

    • Shaded blocks: the 8,441 census blocks within half a mile of a station, colored by homes per acre: light grey for no homes, then pale peach (under 2 per acre) through deep plum (40 or more per acre). Click a block for its nearest station, distance, population, homes and households.
    • Blue outlines: a half-mile (805 m) circle around each station.
    • Purple dots: the stations. Click one for its own half-mile totals.

    Most people within half a mile (2020 census)

    StationPeopleHousing unitsHouseholds
    28,78317,49015,680
    28,1808,2247,228
    23,3289,2358,393
    21,80814,15812,891
    20,0117,0456,572
    18,4558,8768,393
    18,1727,5487,185
    17,21210,4728,580
    16,4916,0675,670
    15,4665,4975,168
    15,0855,5275,157
    14,2466,8496,342
    13,0196,1925,664
    12,0945,2074,910
    11,4204,9694,625

    Fewest people within half a mile (2020 census)

    StationPeopleHousing units
    5724
    11024
    14619
    15260
    215108
    247153
    286102
    287116
    306106
    314136

    What the numbers show

    • The highest totals are at stations in Boston and the inner ring: , the Line stops in Dorchester and Mattapan, Lynn, Malden and . Outside Boston, , , and each have 9,500–11,400 people nearby. The lowest totals are mostly at park-and-ride stops near highways and at outer-end stations.
    • Some totals include a lot of people in dorms. Across all the catchments, 42,700 people live in group quarters, 32,100 of them in college housing. That's why (Northeastern area) and (4,079 people but only 480 homes) have far more people than homes.

    How these were counted

    • Stations: the 144 commuter rail stations in the MBTA's feed in the National Transit Map. They include the newer South Coast Rail stations (, , , , ) and the CapeFLYER stops (, , ). Rhode Island stations aren't included, and neither are Amtrak-only stops. The data has no schedules, so these figures say nothing about how often trains stop.
    • Half a mile is a straight-line 805 m from the station point, not a walking route. A block counts in full if the Census Bureau's interior point for it is inside that distance, so blocks cut by the edge are counted all or nothing.
    • Accuracy: the housing unit counts are exact. The population and household counts have statistical noise added by the census for privacy, so the per-station totals are reliable but a single block's figure isn't.
    • Overlap: per-station totals overlap where stations are close together, such as and or the Line stops. Adding up the station rows would count the same people more than once; the ~699,000 total above counts each block once.

    If you'd prefer walking distance along the street network, a different radius, or each block split between its nearest stations, I can rerun it that way.

This map can’t be panned or zoomed here. In State Planner, you can pan and zoom every map.

Layers

  • 8,441
    • 1,616
    • 1,037
    • 1,740
    • 2,550
    • 1,131
    • 367
  • 144
  • 144

Click anything on the map for its details.

The transcript below the answer shows every query it ran. Shapefiles of every layer, at full detail, can be downloaded in State Planner: sign up to ask your own question and export any map.

Ask your own question about Massachusetts

Send takes you to sign up (every feature free for 7 days, no card needed), or to sign in if you have an account. Your question will be waiting in your new chat.

Transcript

What follows is the transcript of this chat as State Planner generated it. It is here to show how the answer above was arrived at: every query State Planner ran, what each one returned, and where the data came from.

transcript.md

↑ Contents

State Planner chat · https://stateplanner.com

  • State: Massachusetts (MA)
  • Started: November 15, 2026, 2:04 AM UTC
  • Runtime: 1 min 1 sec
  • Status: completed
Prompt

How many people and homes are within half a mile of each Massachusetts commuter rail station? Map the census blocks.

Model: Anthropic: Claude Opus 5.5 (anthropic/claude-opus-5.5, via openrouter), high effort

Response

About 699,000 people and 307,000 homes are within half a mile of at least one of Massachusetts's 144 MBTA commuter rail stations. That's roughly 10% of the state's 2020 population (7.03 million) and 10% of its housing units (3.0 million). The counts are from the 2020 census, by block, and are counted once even where two stations' circles overlap. Of those homes, 285,000 were occupied.

Census Blocks Within Half a Mile of Commuter Rail

Map legend

  • Shaded blocks: the 8,441 census blocks within half a mile of a station, colored by homes per acre: light grey for no homes, then pale peach (under 2 per acre) through deep plum (40 or more per acre). Click a block for its nearest station, distance, population, homes and households.
  • Blue outlines: a half-mile (805 m) circle around each station.
  • Purple dots: the stations. Click one for its own half-mile totals.

Most people within half a mile (2020 census)

StationPeopleHousing unitsHouseholds
Back Bay28,78317,49015,680
Ruggles28,1808,2247,228
Lansdowne23,3289,2358,393
North Station21,80814,15812,891
Four Corners/Geneva20,0117,0456,572
Porter18,4558,8768,393
Lynn Interim18,1727,5487,185
South Station17,21210,4728,580
Uphams Corner16,4916,0675,670
Talbot Avenue15,4665,4975,168
Morton Street15,0855,5275,157
Malden Center14,2466,8496,342
JFK/UMass13,0196,1925,664
Boston Landing12,0945,2074,910
Haverhill11,4204,9694,625

Fewest people within half a mile (2020 census)

StationPeopleHousing units
Freetown5724
East Taunton11024
Grafton14619
Cohasset15260
Wachusett215108
Bourne247153
Kingston286102
Rowley287116
Foxboro306106
Hanson314136

What the numbers show

  • The highest totals are at stations in Boston and the inner ring: Back Bay, the Fairmount Line stops in Dorchester and Mattapan, Lynn, Malden and Porter. Outside Boston, Haverhill, Lowell, Waltham and Lawrence each have 9,500–11,400 people nearby. The lowest totals are mostly at park-and-ride stops near highways and at outer-end stations.
  • Some totals include a lot of people in dorms. Across all the catchments, 42,700 people live in group quarters, 32,100 of them in college housing. That's why Ruggles (Northeastern area) and Bridgewater (4,079 people but only 480 homes) have far more people than homes.

How these were counted

  • Stations: the 144 commuter rail stations in the MBTA's feed in the National Transit Map. They include the newer South Coast Rail stations (Fall River Depot, New Bedford, East Taunton, Freetown, Church Street) and the CapeFLYER stops (Bourne, Buzzards Bay, Hyannis). Rhode Island stations aren't included, and neither are Amtrak-only stops. The data has no schedules, so these figures say nothing about how often trains stop.
  • Half a mile is a straight-line 805 m from the station point, not a walking route. A block counts in full if the Census Bureau's interior point for it is inside that distance, so blocks cut by the edge are counted all or nothing.
  • Accuracy: the housing unit counts are exact. The population and household counts have statistical noise added by the census for privacy, so the per-station totals are reliable but a single block's figure isn't.
  • Overlap: per-station totals overlap where stations are close together, such as Back Bay and South Station or the Fairmount Line stops. Adding up the station rows would count the same people more than once; the ~699,000 total above counts each block once.

If you'd prefer walking distance along the street network, a different radius, or each block split between its nearest stations, I can rerun it that way.

Exploratory Queries
Query 1 — See which feeds and stop types carry rail (route type 2) service.
   SELECT feed_id,
          ntd_id,
          location_type,
          count(*),
          min(stop_name),
          max(stop_name)
     FROM ma_ntm_stops
    WHERE 2 = ANY (route_types)
 GROUP BY 1,
          2,
          3
 ORDER BY 1,
          3
feed_idntd_idlocation_typecountminmax
10003_1100030232AbingtonWyoming Hill
10003_1100031144AbingtonWyoming Hill
10003_1100032791 | Atlantic Ave Dewey Sq Summer StWoodland Rd
10003_1100033463AuburndaleWest Newton
10115_1101153BostonWoburn Amtrak Station

data/turn-1-query-1.csv

Query 2 — List the MBTA commuter rail stations and check which fall outside Massachusetts.
   SELECT s.stop_id,
          s.stop_name,
          s.modes,
          s.wheelchair_boarding,
          st.stusps
     FROM ma_ntm_stops s
LEFT JOIN us_census_states st ON ST_Intersects(st.geom, s.geom)
    WHERE s.feed_id = '10003_1'
      AND s.location_type = 1
      AND 2 = ANY (s.route_types)
 ORDER BY st.stusps NULLS FIRST,
          s.stop_name
stop_idstop_namemodeswheelchair_boardingstusps
place-PB-0194Abington["Rail"]1MA
place-NHRML-0127Anderson/Woburn["Rail","Bus"]1MA
place-WR-0228Andover["Rail","Bus"]1MA
place-WML-0252Ashland["Rail","Bus"]1MA
place-NEC-1969Attleboro["Rail","Bus"]1MA
place-WML-0102Auburndale["Rail"]2MA
place-FR-0361Ayer["Rail","Bus"]2MA
place-bbstaBack Bay["Subway, Metro","Rail","Bus"]1MA
place-WR-0205Ballardvale["Rail","Bus"]1MA
place-NB-0072Bellevue["Rail","Bus"]1MA
place-FR-0064Belmont["Rail","Bus"]2MA
place-ER-0183Beverly["Rail","Bus"]1MA
place-GB-0229Beverly Farms["Rail","Bus"]1MA
place-DB-2222Blue Hill Avenue["Rail","Bus"]1MA
place-WML-0035Boston Landing["Rail","Bus"]1MA
place-CM-0564Bourne["Rail"]1MA
place-WR-0325Bradford["Rail","Bus"]1MA
place-brntnBraintree["Subway, Metro","Rail","Bus"]1MA
place-FR-0115Brandeis/Roberts["Rail","Bus"]1MA
place-MM-0277Bridgewater["Rail"]1MA
place-MM-0200Brockton["Rail"]1MA
place-CM-0547Buzzards Bay["Rail"]1MA
place-MM-0219Campello["Rail"]1MA
place-SB-0156Canton Center["Rail"]1MA
place-NEC-2139Canton Junction["Rail","Bus"]1MA

25 out of 144 are listed here.

data/turn-1-query-2.csv

Query 3 — Count 2020 census people and homes in blocks within half a mile of each commuter rail station.
     WITH st AS MATERIALIZED(
             SELECT stop_id,
                    stop_name,
                    geom
               FROM ma_ntm_stops
              WHERE feed_id = '10003_1'
                AND location_type = 1
                AND 2 = ANY (route_types)
          )
   SELECT st.stop_name,
          count(b.geoid) AS blocks,
          coalesce(sum(b.pop_total), 0) AS pop,
          coalesce(sum(b.housing_units), 0) AS hu,
          coalesce(sum(b.housing_occupied), 0) AS hh
     FROM st
LEFT JOIN ma_census_blocks b ON ST_DWithin(b.internal_point, st.geom, 0.012)
      AND ST_DWithin(b.internal_point::geography, st.geom::geography, 805)
 GROUP BY st.stop_name
 ORDER BY pop DESC
stop_nameblockspophuhh
Back Bay227287831749015680
Ruggles1592818082247228
Lansdowne1582332892358393
North Station184218081415812891
Four Corners/Geneva1482001170456572
Porter1771845588768393
Lynn Interim1151817275487185
South Station21217212104728580
Uphams Corner1511649160675670
Talbot Avenue1201546654975168
Morton Street1271508555275157
Malden Center1241424668496342
JFK/UMass891301961925664
Boston Landing1101209452074910
Haverhill1181142049694625
Chelsea1291133742403975
Lowell1331111143784030
Waltham1121090752964955
Roslindale Village961052346124381
Lawrence83951634703285
Swampscott108944337533562
Oak Grove76905240843847
Blue Hill Avenue96902535763362
Wyoming Hill98883241403965
Salem132845748044462

25 out of 144 are listed here.

data/turn-1-query-3.csv

Query 4 — Total the unique people and homes within half a mile of any station, without double counting overlapping catchments.
     WITH st AS MATERIALIZED(
             SELECT geom
               FROM ma_ntm_stops
              WHERE feed_id = '10003_1'
                AND location_type = 1
                AND 2 = ANY (route_types)
          ),
          blk AS (
             SELECT DISTINCT b.geoid,
                    b.pop_total,
                    b.housing_units,
                    b.housing_occupied,
                    b.pop_group_quarters,
                    b.pop_gq_college
               FROM st
               JOIN ma_census_blocks b ON ST_DWithin(b.internal_point, st.geom, 0.012)
                AND ST_DWithin(b.internal_point::geography, st.geom::geography, 805)
          )
   SELECT count(*) blocks,
          sum(pop_total) pop,
          sum(housing_units) hu,
          sum(housing_occupied) hh,
          sum(pop_group_quarters) gq,
          sum(pop_gq_college) college,
          (
             SELECT sum(pop_total)
               FROM ma_census_blocks
          ) state_pop,
          (
             SELECT sum(housing_units)
               FROM ma_census_blocks
          ) state_hu
     FROM blk
blockspophuhhgqcollegestate_popstate_hu
8441699167307312285192426563214070299172998537

data/turn-1-query-4.csv

Map Layer Queries
Census blocks within ½ mile (homes per acre, 2020) — colored by "cls": No homes (#e6e6e6), Under 2 homes/acre (#fde0c5), 2–5 homes/acre (#facba6), 5–15 homes/acre (#f59e72), 15–40 homes/acre (#e05c5c), 40+ homes/acre (#8b1e5b)
     WITH st AS MATERIALIZED(
             SELECT stop_name,
                    geom
               FROM ma_ntm_stops
              WHERE feed_id = '10003_1'
                AND location_type = 1
                AND 2 = ANY (route_types)
          ),
          pairs AS (
             SELECT DISTINCT ON (b.geoid) b.geoid,
                    b.geom,
                    b.pop_total,
                    b.housing_units,
                    b.housing_occupied,
                    b.aland_m2,
                    st.stop_name,
                    ST_Distance(b.internal_point::geography, st.geom::geography) AS d
               FROM st
               JOIN ma_census_blocks b ON ST_DWithin(b.internal_point, st.geom, 0.012)
                AND ST_DWithin(b.internal_point::geography, st.geom::geography, 805)
           ORDER BY b.geoid,
                    d
          )
   SELECT geom,
          geoid AS "Block",
          stop_name AS "Nearest station",
          round(d) AS "Distance to station(m)",
          pop_total AS "Population 2020 (noise-protected)",
          housing_units AS "Housing units",
          housing_occupied AS "Households",
          round((housing_units::numeric / NULLIF(aland_m2, 0) * 4046.86), 1) AS "Homes per acre",
          CASE
                    WHEN housing_units = 0 THEN 'none'
                    WHEN housing_units::numeric / NULLIF(aland_m2, 0) * 4046.86 < 2 THEN 'lt2'
                    WHEN housing_units::numeric / NULLIF(aland_m2, 0) * 4046.86 < 5 THEN '2to5'
                    WHEN housing_units::numeric / NULLIF(aland_m2, 0) * 4046.86 < 15 THEN '5to15'
                    WHEN housing_units::numeric / NULLIF(aland_m2, 0) * 4046.86 < 40 THEN '15to40'
                    ELSE '40plus'
          END AS cls
     FROM pairs

Picture: maps/turn-1-commuter-rail-half-mile-blocks.png

½-mile (805 m) station radius
   SELECT ST_Buffer(geom::geography, 805)::geometry AS geom,
          stop_name AS "Station"
     FROM ma_ntm_stops
    WHERE feed_id = '10003_1'
      AND location_type = 1
      AND 2 = ANY (route_types)

Picture: maps/turn-1-commuter-rail-half-mile-blocks.png

Commuter rail stations (MBTA)
     WITH st AS MATERIALIZED(
             SELECT stop_name,
                    wheelchair_boarding,
                    geom
               FROM ma_ntm_stops
              WHERE feed_id = '10003_1'
                AND location_type = 1
                AND 2 = ANY (route_types)
          )
   SELECT st.geom,
          st.stop_name AS "Station",
          s.pop AS "People within ½ mile(2020)",
          s.hu AS "Housing units within ½ mile",
          s.hh AS "Households within ½ mile"
     FROM st
    CROSS JOIN LATERAL (
             SELECT coalesce(sum(b.pop_total), 0) pop,
                    coalesce(sum(b.housing_units), 0) hu,
                    coalesce(sum(b.housing_occupied), 0) hh
               FROM ma_census_blocks b
              WHERE ST_DWithin(b.internal_point, st.geom, 0.012)
                AND ST_DWithin(b.internal_point::geography, st.geom::geography, 805)
          ) s

Picture: maps/turn-1-commuter-rail-half-mile-blocks.png

Used Data Sets

data/turn-1-query-1.csv

↑ Contents
feed_idntd_idlocation_typecountminmax
10003_1100030232AbingtonWyoming Hill
10003_1100031144AbingtonWyoming Hill
10003_1100032791 | Atlantic Ave Dewey Sq Summer StWoodland Rd
10003_1100033463AuburndaleWest Newton
10115_1101153BostonWoburn Amtrak Station

5 rows.

data/turn-1-query-2.csv

↑ Contents
stop_idstop_namemodeswheelchair_boardingstusps
place-PB-0194Abington["Rail"]1MA
place-NHRML-0127Anderson/Woburn["Rail","Bus"]1MA
place-WR-0228Andover["Rail","Bus"]1MA
place-WML-0252Ashland["Rail","Bus"]1MA
place-NEC-1969Attleboro["Rail","Bus"]1MA
place-WML-0102Auburndale["Rail"]2MA
place-FR-0361Ayer["Rail","Bus"]2MA
place-bbstaBack Bay["Subway, Metro","Rail","Bus"]1MA
place-WR-0205Ballardvale["Rail","Bus"]1MA
place-NB-0072Bellevue["Rail","Bus"]1MA
place-FR-0064Belmont["Rail","Bus"]2MA
place-ER-0183Beverly["Rail","Bus"]1MA
place-GB-0229Beverly Farms["Rail","Bus"]1MA
place-DB-2222Blue Hill Avenue["Rail","Bus"]1MA
place-WML-0035Boston Landing["Rail","Bus"]1MA
place-CM-0564Bourne["Rail"]1MA
place-WR-0325Bradford["Rail","Bus"]1MA
place-brntnBraintree["Subway, Metro","Rail","Bus"]1MA
place-FR-0115Brandeis/Roberts["Rail","Bus"]1MA
place-MM-0277Bridgewater["Rail"]1MA
place-MM-0200Brockton["Rail"]1MA
place-CM-0547Buzzards Bay["Rail"]1MA
place-MM-0219Campello["Rail"]1MA
place-SB-0156Canton Center["Rail"]1MA
place-NEC-2139Canton Junction["Rail","Bus"]1MA
place-chelsChelsea["Rail","Bus"]1MA
place-NBM-0523Church Street["Rail","Bus"]1MA
place-GRB-0199Cohasset["Rail"]1MA
place-FR-0201Concord["Rail","Bus"]2MA
place-FB-0118Dedham Corporate Center["Rail","Bus"]1MA
place-NBM-0374East Taunton["Rail","Bus"]1MA
place-GRB-0146East Weymouth["Rail"]1MA
place-FB-0109Endicott["Rail"]2MA
place-DB-2205Fairmount["Rail","Bus"]1MA
place-FRS-0109Fall River Depot["Rail","Bus"]1MA
place-FR-0494Fitchburg["Rail","Bus"]1MA
place-forhlForest Hills["Subway, Metro","Rail","Bus"]1MA
place-FB-0303Forge Park/495["Rail","Bus"]1MA
place-DB-2249Four Corners/Geneva["Rail","Bus"]1MA
place-FS-0049Foxboro["Rail","Bus"]1MA
place-WML-0214Framingham["Rail","Bus"]1MA
place-FB-0275Franklin["Rail","Bus"]1MA
place-FRS-0054Freetown["Rail","Bus"]1MA
place-GB-0316Gloucester["Rail","Bus"]1MA
place-WML-0364Grafton["Rail"]1MA
place-GRB-0276Greenbush["Rail","Bus"]1MA
place-WR-0085Greenwood["Rail","Bus"]2MA
place-PB-0281Halifax["Rail","Bus"]1MA
place-ER-0227Hamilton/Wenham["Rail","Bus"]1MA
place-PB-0245Hanson["Rail"]1MA
place-WR-0329Haverhill["Rail","Bus"]1MA
place-NB-0109Hersey["Rail","Bus"]1MA
place-NB-0076Highland["Rail","Bus"]1MA
place-MM-0150Holbrook/Randolph["Rail","Bus"]1MA
place-CM-0790Hyannis["Rail"]1MA
place-NEC-2203Hyde Park["Rail"]1MA
place-ER-0276Ipswich["Rail","Bus"]1MA
place-FB-0125Islington["Rail"]2MA
place-jfkJFK/UMass["Subway, Metro","Rail","Bus"]1MA
place-FR-0132Kendal Green["Rail"]2MA
place-KB-0351Kingston["Rail","Bus"]1MA
place-MM-0356Lakeville["Rail"]1MA
place-WML-0025Lansdowne["Rail"]1MA
place-WR-0264Lawrence["Rail","Bus"]1MA
place-FR-0167Lincoln["Rail","Bus"]2MA
place-FR-0301Littleton/Route 495["Rail","Bus"]1MA
place-NHRML-0254Lowell["Rail","Bus"]1MA
place-ER-0117Lynn Interim["Rail"]1MA
place-mlmnlMalden Center["Subway, Metro","Rail","Bus"]1MA
place-GB-0254Manchester["Rail","Bus"]1MA
place-NEC-2040Mansfield["Rail"]1MA
place-WR-0067Melrose/Cedar Park["Rail","Bus"]2MA
place-WR-0075Melrose Highlands["Rail","Bus"]1MA
place-MBS-0350Middleborough["Rail","Bus"]1MA
place-MM-0186Montello["Rail","Bus"]1MA
place-GB-0198Montserrat["Rail","Bus"]1MA
place-DB-2230Morton Street["Rail","Bus"]1MA
place-GRB-0183Nantasket Junction["Rail","Bus"]1MA
place-WML-0177Natick Center["Rail"]1MA
place-NB-0127Needham Center["Rail","Bus"]1MA
place-NB-0137Needham Heights["Rail","Bus"]1MA
place-NB-0120Needham Junction["Rail","Bus"]1MA
place-NBM-0546New Bedford["Rail","Bus"]1MA
place-ER-0362Newburyport["Rail","Bus"]1MA
place-DB-2265Newmarket["Rail","Bus"]1MA
place-WML-0081Newtonville["Rail"]2MA
place-FB-0230Norfolk["Rail","Bus"]1MA
place-ER-0208North Beverly["Rail","Bus"]1MA
place-NHRML-0218North Billerica["Rail","Bus"]1MA
place-FR-0451North Leominster["Rail","Bus"]1MA
place-GRB-0233North Scituate["Rail","Bus"]1MA
place-northNorth Station["Tram, Streetcar, Light rail","Subway, Metro","Rail","Bus"]1MA
place-WR-0163North Wilmington["Rail","Bus"]1MA
place-FB-0148Norwood Central["Rail","Bus"]1MA
place-FB-0143Norwood Depot["Rail"]1MA
place-ogmnlOak Grove["Subway, Metro","Rail","Bus"]1MA
place-portrPorter["Subway, Metro","Rail"]1MA
place-qnctrQuincy Center["Subway, Metro","Rail","Bus"]1MA
place-WR-0120Reading["Rail","Bus"]1MA
place-DB-0095Readville["Rail","Bus"]1MA
place-ER-0099River Works["Rail"]2MA
place-GB-0353Rockport["Rail","Bus"]1MA
place-NB-0064Roslindale Village["Rail","Bus"]1MA
place-NEC-2173Route 128["Rail"]1MA
place-ER-0312Rowley["Rail","Bus"]1MA
place-ruggRuggles["Subway, Metro","Rail","Bus"]1MA
place-ER-0168Salem["Rail","Bus"]1MA
place-NEC-2108Sharon["Rail"]1MA
place-FR-0394Shirley["Rail","Bus"]2MA
place-FR-0147Silver Hill["Rail"]2MA
place-FR-0253South Acton["Rail","Bus"]1MA
place-NEC-1919South Attleboro["Rail"]1MA
place-WML-0274Southborough["Rail"]1MA
place-sstatSouth Station["Subway, Metro","Rail","Bus"]1MA
place-PB-0158South Weymouth["Rail","Bus"]1MA
place-SB-0189Stoughton["Rail"]1MA
place-ER-0128Swampscott["Rail","Bus"]1MA
place-DB-2240Talbot Avenue["Rail","Bus"]1MA
place-DB-2258Uphams Corner["Rail","Bus"]1MA
place-FR-3338Wachusett["Rail","Bus"]1MA
place-WR-0099Wakefield["Rail","Bus"]2MA
place-FB-0191Walpole["Rail","Bus"]1MA
place-FR-0098Waltham["Rail","Bus"]1MA
place-CM-0493Wareham Village["Rail"]1MA
place-FR-0074Waverley["Rail","Bus"]2MA
place-NHRML-0073Wedgemere["Rail","Bus"]1MA
place-WML-0125Wellesley Farms["Rail"]2MA
place-WML-0135Wellesley Hills["Rail"]2MA
place-WML-0147Wellesley Square["Rail"]1MA
place-WML-0340Westborough["Rail"]1MA
place-FR-0219West Concord["Rail","Bus"]1MA
place-GB-0296West Gloucester["Rail","Bus"]1MA
place-GRB-0162West Hingham["Rail"]1MA
place-NHRML-0055West Medford["Rail","Bus"]1MA
place-WML-0199West Natick["Rail"]1MA
place-WML-0091West Newton["Rail"]2MA
place-NB-0080West Roxbury["Rail","Bus"]1MA
place-GRB-0118Weymouth Landing/East Braintree["Rail"]1MA
place-PB-0212Whitman["Rail"]1MA
place-NHRML-0152Wilmington["Rail","Bus"]1MA
place-NHRML-0078Winchester Center["Rail"]1MA
place-FB-0166Windsor Gardens["Rail","Bus"]2MA
place-WML-0442Worcester["Rail"]1MA
place-WR-0062Wyoming Hill["Rail","Bus"]2MA

144 rows.

data/turn-1-query-3.csv

↑ Contents
stop_nameblockspophuhh
Back Bay227287831749015680
Ruggles1592818082247228
Lansdowne1582332892358393
North Station184218081415812891
Four Corners/Geneva1482001170456572
Porter1771845588768393
Lynn Interim1151817275487185
South Station21217212104728580
Uphams Corner1511649160675670
Talbot Avenue1201546654975168
Morton Street1271508555275157
Malden Center1241424668496342
JFK/UMass891301961925664
Boston Landing1101209452074910
Haverhill1181142049694625
Chelsea1291133742403975
Lowell1331111143784030
Waltham1121090752964955
Roslindale Village961052346124381
Lawrence83951634703285
Swampscott108944337533562
Oak Grove76905240843847
Blue Hill Avenue96902535763362
Wyoming Hill98883241403965
Salem132845748044462
Fairmount105818933163211
Quincy Center91813842904037
Bellevue102811634813374
Gloucester111809239583781
Bradford79787532253054
Beverly111764942473968
Fitchburg140762734293049
Hyde Park95752130982980
Forest Hills78729536673371
Brockton91709028492723
West Medford109682229052778
Melrose/Cedar Park93679132273089
Highland98674728322701
Framingham68661327582455
Waverley83656627972705
Worcester127650831742897
Melrose Highlands85616526992619
Newmarket103611224942171
Attleboro108607028832650
Campello67590322672126
Newtonville82588326832490
Norwood Depot67580028402758
West Roxbury80574625932443
New Bedford105559031152860
West Natick45558625352463
Fall River Depot92543927212408
Montello61523018751763
Weymouth Landing/East Braintree82519422472129
Wakefield68511025882467
Auburndale74484816991620
Natick Center81480522832142
Needham Heights65472218091761
Norwood Central78461022162119
Reading79450320201838
West Newton84449117101666
Windsor Gardens28444219331808
Stoughton74434419001763
Readville63418316681580
Bridgewater244079480457
Brandeis/Roberts454043877766
Endicott60403115021449
Belmont66390813591328
Franklin43360513241252
Hersey56355311401128
Wedgemere61348111911148
Mansfield67337816661591
Winchester Center77337812821235
Needham Junction52329613001230
Wellesley Square54327315801446
Ipswich57325216831598
Needham Center69313711451084
Greenwood41312712461219
Montserrat49310212991224
Church Street62284012291170
Canton Center36277513551282
East Weymouth42276611441102
Andover45258613071226
Islington472550906840
Holbrook/Randolph442506824802
Canton Junction25247410591036
Braintree4724221007956
South Weymouth23240011981126
North Beverly352306884840
Wellesley Hills452174746724
Ayer5521661106999
Whitman332127917850
Rockport2820451187979
Wellesley Farms521992672638
Abington251951858833
Concord391935863812
Manchester281917967866
Middleborough291898863811
West Concord411844963858
Hyannis361770848759
Dedham Corporate Center281708823783
North Billerica251615642617
Hamilton/Wenham391544610584
North Wilmington161439524518
Sharon261436536513
Ashland111429710675
Wilmington221381559544
Walpole321335931663
Shirley301322622571
Wareham Village231206669599
River Works221187366341
Beverly Farms181174547521
Ballardvale181166436411
North Leominster351058382366
Halifax111055462453
Buzzards Bay531031582465
Southborough17968326319
South Attleboro15961546507
Silver Hill19957325319
West Hingham11949343325
Nantasket Junction16810281268
Route 12820622377355
Lakeville21613344300
Lincoln5613278265
Kendal Green11612204180
Newburyport21606274267
Norfolk7594298291
South Acton14540211207
Westborough7533179179
Anderson/Woburn14513203198
West Gloucester11513203194
North Scituate13473211199
Greenbush12384153151
Littleton/Route 495113658685
Forge Park/49514315121110
Hanson4314136116
Foxboro9306106100
Rowley11287116109
Kingston3286102102
Bourne19247153119
Wachusett16215108108
Cohasset81526052
Grafton61461917
East Taunton81102419
Freetown10572424

144 rows.

data/turn-1-query-4.csv

↑ Contents
blockspophuhhgqcollegestate_popstate_hu
8441699167307312285192426563214070299172998537

1 row.

provenance/ma_census_blocks.md

↑ Contents

Provenance: ma_census_blocks

This file describes how the rows in PostgreSQL table ma_census_blocks were obtained from an external source: where they were fetched and how fields were renamed and typed. Field meanings are in the mapping table below.

Identity
Pipeline (Census family)

US Census Bureau sources, one row per 2020 tabulation block of Massachusetts.

  • Outlines — the state's TIGER/Line 2020 tabulation block shapefile, from the newest TIGER/Line release that has one, read with GDAL. Coordinates are taken as published (NAD83) and labelled EPSG:4326. Invalid polygons are repaired with ST_MakeValid.
  • Redistricting counts — Census API 2020 P.L. 94-171 file, by block, a request per county: tables P1 (total population), P2 (Hispanic or Latino, and not Hispanic by race), P3 (population 18 and over) and H1 (housing units by occupancy).
  • Characteristics — Census API 2020 Demographic and Housing Characteristics file, by block, a request per county: P12 (sex by age), P18 (group quarters population by sex, age and major type), H4 (tenure) and H5 (vacancy status).

Counts are joined to outlines on the 15-digit block identifier. A block the API returns no row for has no people and no housing and is stored with zeros. Before the table is published the load checks that every count has an outline, that every block the shapefile gives people or housing has counts, and that the statewide population equals the published 2020 census total.

A Census API key is required to fetch the tabular releases.

Field → column mapping
Source fieldColumnTypeDescription
GEOID20geoidvarchar(15)Block identifier: state+county+tract+block
GEOID20 (digits 1–2)state_fipsvarchar(2)State FIPS, always 25 (Massachusetts)
GEOID20 (digits 3–5)county_fipsvarchar(3)County FIPS code
GEOID20 (digits 1–11)tract_geoidvarchar(11)Census tract identifier
GEOID20 (digits 1–12)bg_geoidvarchar(12)Block group identifier
GEOID20 (digits 12–15)block_numbervarchar(4)Block number within the tract
UR20urban_ruraltextU → urban, R → rural
UR20urban_rural_codevarchar(1)U or R
UACE20urban_area_codevarchar(5)2020 census urban area code; NULL for a rural block
ALAND20aland_m2bigintLand area, square metres
AWATER20awater_m2bigintWater area, square metres
P1_001Npop_totalintegerTotal population
P3_001Npop_18_plusintegerPopulation 18 years and over
P2_002Npop_hispanicintegerHispanic or Latino, any race
P2_005Npop_white_nhintegerWhite alone, not Hispanic
P2_006Npop_black_nhintegerBlack or African American alone, not Hispanic
P2_007Npop_amind_nhintegerAmerican Indian and Alaska Native alone, not Hispanic
P2_008Npop_asian_nhintegerAsian alone, not Hispanic
P2_009Npop_nhpi_nhintegerNative Hawaiian and Other Pacific Islander alone, not Hispanic
P2_010Npop_other_nhintegerSome other race alone, not Hispanic
P2_011Npop_two_plus_nhintegerTwo or more races, not Hispanic
H1_001Nhousing_unitsintegerTotal housing units
H1_002Nhousing_occupiedintegerOccupied housing units
H1_003Nhousing_vacantintegerVacant housing units
P12_020N–025N + P12_044N–049Npop_65_plusintegerPopulation 65 years and over (the six oldest age groups of each sex)
P18_001Npop_group_quartersintegerPopulation in group quarters
P18_004N + 014N + 024N + 035N + 045N + 055Npop_gq_institutionalintegerInstitutionalized population (each sex's three age groups)
P18_010N + 020N + 030N + 041N + 051N + 061Npop_gq_collegeintegerPopulation in college or university student housing
H4_002N + H4_003Nhousing_owner_occupiedintegerOwned with a mortgage or loan, plus owned free and clear
H4_004Nhousing_renter_occupiedintegerRenter occupied
H5_006Nhousing_seasonalintegerVacant, for seasonal, recreational or occasional use
INTPTLON20, INTPTLAT20internal_pointgeometry(Point, 4326)The block's internal point
(shape)geomgeometry(MultiPolygon, 4326)Block boundary
Geometry
  • SRID 4326 (WGS84). GIST indexes on geom and internal_point.
Attribution

US Census Bureau. This product uses the Census Bureau Data API but is not endorsed or certified by the Census Bureau.

provenance/ma_ntm_stops.md

↑ Contents

Provenance: ma_ntm_stops

This file describes how the rows in PostgreSQL table ma_ntm_stops were obtained from an external source: where they were fetched and how fields were renamed and typed. Field meanings are in the mapping table below.

Identity
Pipeline (NTM family)

The Bureau of Transportation Statistics National Transit Map: three national ArcGIS FeatureServer layers (routes, stops, agencies), each walked once by keyset on OBJECTID and stored as gzipped GeoJSON pages. Each state is cut from that national copy at build time: a feature whose bounding box meets the state's box is a candidate, and a candidate is kept when it touches one of ma_census_counties (TIGER outlines, water included). A route that crosses the state line is kept whole. Agencies are those based in the state or named by the ntd_id of a kept route or stop.

Changed from the source: cut to Massachusetts, empty strings and Null stored as NULL, GTFS codes typed as smallint, ;-lists split into arrays, download_date typed as a date, Shape__Length (degrees) dropped and length_m computed.

CC BY 3.0 US (the items' license); attribution to USDOT/BTS and to City of Lawndale and Via Mobility Services, whose feeds BTS holds under CC BY. Since Report Year 2023 the GTFS that NTD reporters submit enters the public domain.

Field → column mapping
Source fieldColumnEsri typeDescription
OBJECTIDobjectidOIDBTS's row id
ntd_idntd_id, ntd_idsStringNTD id(s), split on ; for the array
feed_idfeed_idStringGTFS feed
stop_idstop_idString
stop_codestop_codeString
stop_namestop_nameString
stop_descstop_descString
location_typelocation_typeString → smallint
parent_stationparent_stationString
wheelchair_boardingwheelchair_boardingString → smallint
platform_codeplatform_codeString
level_idlevel_idString
zone_idzone_idString
stop_urlstop_urlString
stop_timezonestop_timezoneString
stop_typeroute_typesString → smallint[]split on ;
stop_type_textmodesString → text[]split on ;, quotes removed
download_datedownload_dateString → date
stop_lat, stop_lon(dropped)Doublethe point geometry carries them
Geometry
  • Source points, outSR 4326.

provenance/us_census_states.md

↑ Contents

Provenance: us_census_states

This file describes how the rows in PostgreSQL table us_census_states were obtained from an external source: where they were fetched and how fields were renamed and typed. Field meanings are in the mapping table below.

Identity
Pipeline

One Census Bureau source, read once by the Census sync's national target (US):

  • Boundaries: TIGERweb tigerWMS_Current layer 80 ("States"), where=STATE IN (<the 51 FIPS codes>), GeoJSON, outSR=4326, keyset-paged on GEOID. The layer also holds Puerto Rico, Guam, the Northern Mariana Islands, American Samoa and the US Virgin Islands; the filter leaves them out, as the national population tables do.

The sync fails unless exactly the 50 states and DC arrive, each once.

Field → column mapping
Source fieldColumnTypeDescription
TIGER GEOIDgeoidvarchar(2)state FIPS
TIGER STUSABstuspsvarchar(2)postal code
TIGER NAMEnamevarchar(40)e.g. Ohio
TIGER REGIONregionvarchar(1)Census region
TIGER DIVISIONdivisionvarchar(1)Census division
TIGER AREALANDaland_m2bigintsquare meters
TIGER AREAWATERawater_m2bigintsquare meters
TIGER INTPTLATintptlatdouble precisioninternal point
TIGER INTPTLONintptlondouble precisioninternal point
geometrygeomgeometry(MultiPolygon, 4326)ST_Multi(ST_MakeValid(ST_GeomFromGeoJSON))
Geometry
  • Legal boundaries, the same TIGER vintage as every state's census_counties, so a state's outline is the union of its counties. They extend into the Great Lakes and coastal water; nothing is clipped to the shoreline.
Change detection

The check reads the layer's vintage from its description and counts the filtered rows. A new vintage or a changed count marks this table stale, and the next Census sync rebuilds it whole.

Attribution

US Census Bureau, TIGER/Line via TIGERweb.

© 2026 State Planner