State Planner

Missouri · October 26, 2026

New Housing Units Permitted by County, 2020-2025

This is a real answer State Planner produced from Missouri’s public data.

Ask this question, or one like it, in State Planner now. Sign up to try every feature free for 7 days, no card needed, and the question will be waiting in your new chat to change or send.

Ask this in State Planner →
  1. Missouri Building Permits by County: New Housing Units 2020-2025

    Now the map and a yearly chart.


    Missouri building permits by county: new housing units, 2020–2025

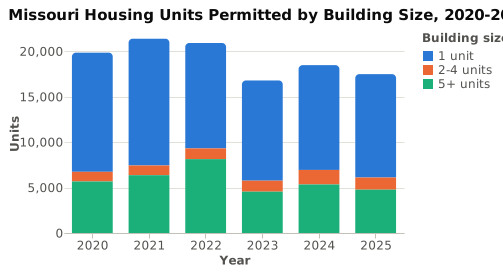
    From 2020 through 2025, building permits authorized about 114,800 new privately owned housing units in Missouri. These figures come from the Census Bureau's Building Permits Survey, using its estimates with imputation. The yearly total peaked at 21,372 units in 2021, fell to 16,781 in 2023, and was 17,474 in 2025. Single-family homes made up about 63% of all units. Buildings with 5 or more units peaked at about 8,100 units in 2022.
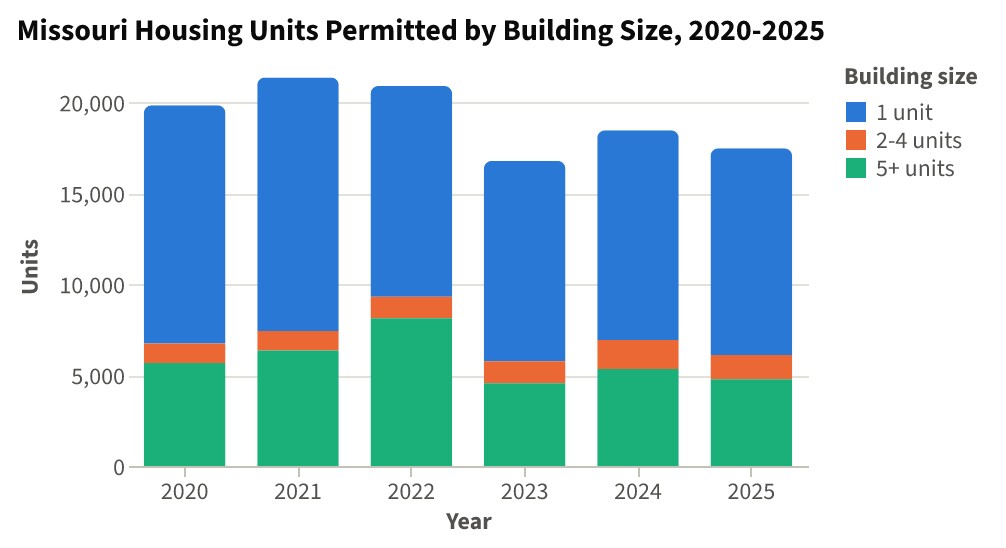
    Missouri Housing Units Permitted by Building Size, 2020-2025⬇ CSV⬇ Image

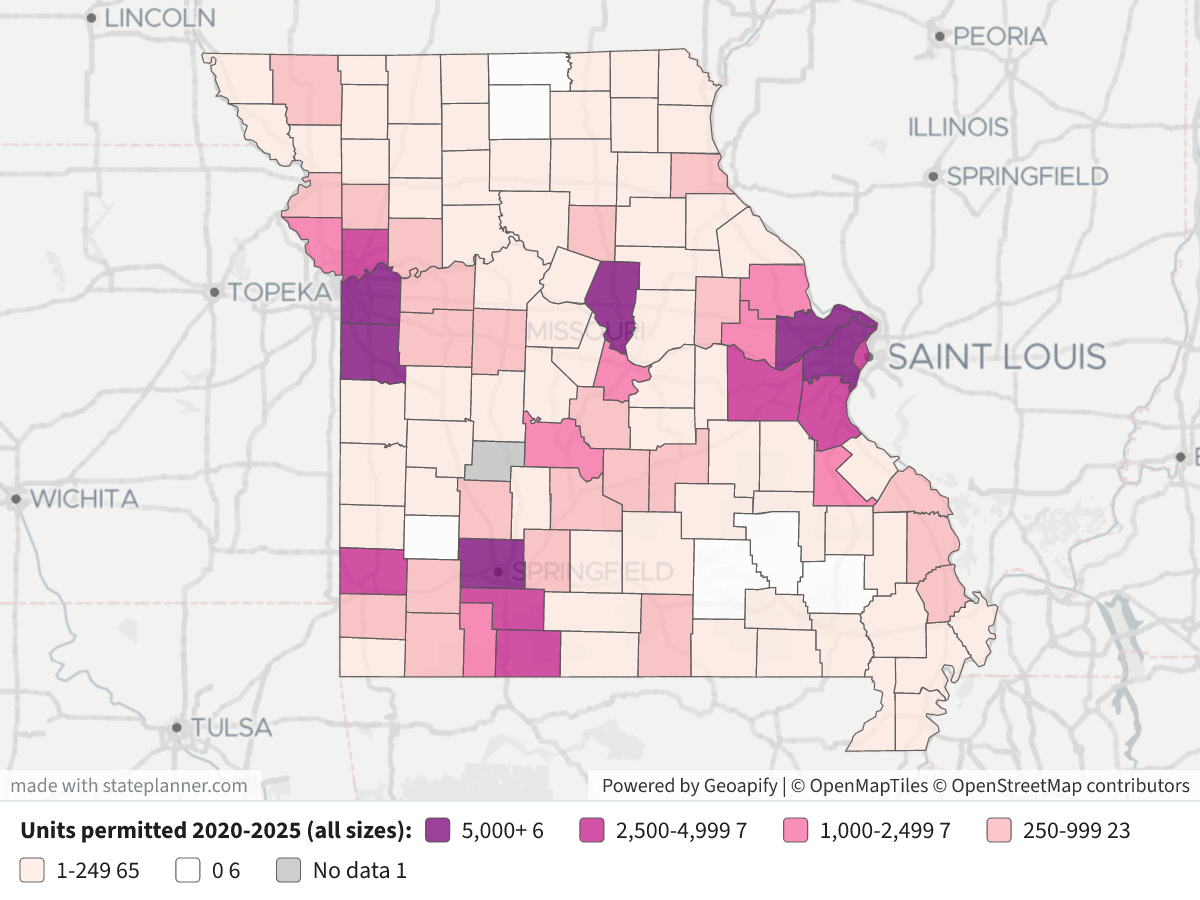
    New Housing Units Permitted by County, 2020-2025New Housing Units Permitted by County, 2020-2025⬇ Image

    Map legend: Each county is shaded by the total units permitted from 2020 to 2025: dark purple for 5,000 or more, then magenta for 2,500–4,999, pink for 1,000–2,499, light pink for 250–999, pale for 1–249, white for 0, and gray for no data. Click a county to see its building-size breakdown and its units per 1,000 residents, based on the 2025 population estimate.

    Top 20 counties by new housing units permitted, 2020–2025

    CountyUnitsSingle-family5+ unit bldgsPer 1,000 residents
    Jackson23,38710,02711,48731.9
    St. Charles14,9728,9445,68535.1
    St. Louis County7,3464,8272,4887.4
    Greene7,3095,1811,87323.6
    Boone5,4394,1781,19128.4
    Cass5,2933,3571,38245.7
    Jasper4,6653,0351,04236.6
    Jefferson4,5504,25520019.5
    Christian3,9243,38430740.6
    Franklin3,6862,65191134.1
    St. Louis city3,3975562,76712.2
    Clay2,8741,6061,20610.8
    Taney2,6622,21135046.7
    Warren2,2171,60249156.8
    Camden2,1181,51646148.1
    Platte2,0461,59329917.9
    Stone1,4921,4093545.9
    St. Francois1,16846853817.2
    Lincoln1,10275122816.5
    Cole1,011938013.0

    Findings

    • Jackson County had about 20% of the state's permitted units, and nearly half of its units were in buildings of 5 or more units. Together with St. Charles County, it accounts for a third of the statewide total.
    • Per resident, the highest rates were in Warren (56.8 per 1,000), Camden (48.1), Taney (46.7), Stone (45.9) and Cass (45.7). St. Louis County ranks third by total units but has one of the lowest rates (7.4 per 1,000).
    • In St. Louis city, most units were in 5+ unit buildings (2,767 of 3,397).

    Notes

    • Missing or zero counties: Hickory County has no permit rows in 2020–2025, and Wayne County has rows for only 3 of the 6 years. Dade, Putnam, Reynolds, Shannon, Sullivan and Wayne report zero units. This usually means few or no places in those counties issue permits, not that nothing was built.
    • What's not counted: The survey covers only new private housing. Manufactured homes, conversions and construction in areas without permit requirements are not included.
    • Permits aren't completions: A permit authorizes construction. It is not a start or a completion, and some permitted units are never built.
    • Population basis: The per-1,000 rates divide six years of permits by the 2025 Census population estimate.

    I can also break this down by city or permit office, show construction value, or compare these years with the mid-2000s peak.

Layers

  • …
    • …
    • …
    • …
    • …
    • …
    • …
    • …

Click anything on the map for its details.

The transcript below the answer shows every query it ran. Shapefiles of every layer, at full detail, can be downloaded in State Planner: sign up to ask your own question and export any map.

Ask your own question about Missouri

Send takes you to sign up (every feature free for 7 days, no card needed), or to sign in if you have an account. Your question will be waiting in your new chat.

Transcript

What follows is the transcript of this chat as State Planner generated it. It is here to show how the answer above was arrived at: every query State Planner ran, what each one returned, and where the data came from.

transcript.md

↑ Contents

State Planner chat · https://stateplanner.com

  • State: Missouri (MO)
  • Started: October 26, 2026, 3:40 PM UTC
  • Runtime: 40 sec
  • Status: completed
Prompt

Missouri Building Permits by County: New Housing Units 2020-2025

Model: Anthropic: Claude Opus 5.5 (anthropic/claude-opus-5.5, via openrouter)

Response

Now the map and a yearly chart.


Missouri building permits by county: new housing units, 2020–2025

From 2020 through 2025, building permits authorized about 114,800 new privately owned housing units in Missouri. These figures come from the Census Bureau's Building Permits Survey, using its estimates with imputation. The yearly total peaked at 21,372 units in 2021, fell to 16,781 in 2023, and was 17,474 in 2025. Single-family homes made up about 63% of all units. Buildings with 5 or more units peaked at about 8,100 units in 2022.

Missouri Housing Units Permitted by Building Size, 2020-2025

New Housing Units Permitted by County, 2020-2025

Map legend: Each county is shaded by the total units permitted from 2020 to 2025: dark purple for 5,000 or more, then magenta for 2,500–4,999, pink for 1,000–2,499, light pink for 250–999, pale for 1–249, white for 0, and gray for no data. Click a county to see its building-size breakdown and its units per 1,000 residents, based on the 2025 population estimate.

Top 20 counties by new housing units permitted, 2020–2025

CountyUnitsSingle-family5+ unit bldgsPer 1,000 residents
Jackson23,38710,02711,48731.9
St. Charles14,9728,9445,68535.1
St. Louis County7,3464,8272,4887.4
Greene7,3095,1811,87323.6
Boone5,4394,1781,19128.4
Cass5,2933,3571,38245.7
Jasper4,6653,0351,04236.6
Jefferson4,5504,25520019.5
Christian3,9243,38430740.6
Franklin3,6862,65191134.1
St. Louis city3,3975562,76712.2
Clay2,8741,6061,20610.8
Taney2,6622,21135046.7
Warren2,2171,60249156.8
Camden2,1181,51646148.1
Platte2,0461,59329917.9
Stone1,4921,4093545.9
St. Francois1,16846853817.2
Lincoln1,10275122816.5
Cole1,011938013.0

Findings

  • Jackson County had about 20% of the state's permitted units, and nearly half of its units were in buildings of 5 or more units. Together with St. Charles County, it accounts for a third of the statewide total.
  • Per resident, the highest rates were in Warren (56.8 per 1,000), Camden (48.1), Taney (46.7), Stone (45.9) and Cass (45.7). St. Louis County ranks third by total units but has one of the lowest rates (7.4 per 1,000).
  • In St. Louis city, most units were in 5+ unit buildings (2,767 of 3,397).

Notes

  • Missing or zero counties: Hickory County has no permit rows in 2020–2025, and Wayne County has rows for only 3 of the 6 years. Dade, Putnam, Reynolds, Shannon, Sullivan and Wayne report zero units. This usually means few or no places in those counties issue permits, not that nothing was built.
  • What's not counted: The survey covers only new private housing. Manufactured homes, conversions and construction in areas without permit requirements are not included.
  • Permits aren't completions: A permit authorizes construction. It is not a start or a completion, and some permitted units are never built.
  • Population basis: The per-1,000 rates divide six years of permits by the 2025 Census population estimate.

I can also break this down by city or permit office, show construction value, or compare these years with the mid-2000s peak.

Chart Queries
Missouri Housing Units Permitted by Building Size, 2020-2025
   SELECT YEAR AS "Year",
          s AS "Building size",
          u AS "Units"
     FROM (
             SELECT YEAR,
                    sum(units_1) a,
                    sum(units_2 + units_3_4) b,
                    sum(units_5plus) c
               FROM mo_bps_county_permits
              WHERE YEAR BETWEEN 2020 AND 2025
           GROUP BY YEAR
          ) t
    CROSS JOIN LATERAL (
             VALUES ('1 unit', a),
                    ('2-4 units', b),
                    ('5+ units', c)
          ) v(s, u)
 ORDER BY 1

charts/turn-1-mo-units-by-year.csv

Picture: charts/turn-1-mo-units-by-year.png

Exploratory Queries
Query 1 — Check year coverage and statewide totals 2020-2025.
   SELECT YEAR,
          count(*) n,
          sum(units_total) units,
          sum(units_1) sf,
          sum(units_2 + units_3_4) small_mf,
          sum(units_5plus) mf5
     FROM mo_bps_county_permits
    WHERE YEAR >= 2020
 GROUP BY YEAR
 ORDER BY YEAR
yearnunitssfsmall_mfmf5
2020114198391310710645668
2021114213721394110736358
2022114209011159811788125
2023113167811102212094550
2024113184641152815995337
2025113174741137413344766

data/turn-1-query-1.csv

Query 2 — Rank counties by total units 2020-2025, with mix and rate per 1,000 residents.
     WITH p AS (
             SELECT geoid,
                    sum(units_total) u,
                    sum(units_1) sf,
                    sum(units_5plus) mf5,
                    count(*) yrs
               FROM mo_bps_county_permits
              WHERE YEAR BETWEEN 2020 AND 2025
           GROUP BY geoid
          ),
          pop AS (
             SELECT geoid,
                    pop_estimate
               FROM mo_census_county_pop_est
              WHERE YEAR = (
                       SELECT max(YEAR)
                         FROM mo_census_county_pop_est
                    )
          )
   SELECT c.name,
          p.*,
          pop.pop_estimate,
          round(1000.0 * p.u / pop.pop_estimate, 1) per1k,
          (
             SELECT max(YEAR)
               FROM mo_census_county_pop_est
          ) popyr
     FROM p
LEFT JOIN mo_census_counties c USING (geoid)
LEFT JOIN pop USING (geoid)
 ORDER BY u DESC
    LIMIT 20
namegeoidusfmf5yrspop_estimateper1kpopyr
Jackson County29095233871002711487673299431.92025
St. Charles County291831497289445685642649935.12025
St. Louis County2918973464827248869909117.42025
Greene County29077730951811873630928623.62025
Boone County29019543941781191619174628.42025
Cass County29037529333571382611585945.72025
Jasper County29097466530351042612742836.62025
Jefferson County2909945504255200623313219.52025
Christian County290433924338430769672540.62025
Franklin County2907136862651911610809034.12025
St. Louis city2951033975562767627814412.22025
Clay County29047287416061206626503210.82025
Taney County292132662221135065700146.72025
Warren County292192217160249163901656.82025
Camden County290292118151646164404748.12025
Platte County2916520461593299611440017.92025
Stone County29209149214093563250345.92025
St. Francois County29187116846853866780917.22025
Lincoln County29113110275122866667616.52025
Cole County290511011938067790813.02025

data/turn-1-query-2.csv

Query 3 — Find counties with missing years or no permits listed.
   SELECT c.name,
          c.geoid,
          count(p.year) yrs,
          coalesce(sum(p.units_total), 0) u
     FROM mo_census_counties c
LEFT JOIN mo_bps_county_permits p ON p.geoid = c.geoid
      AND p.year BETWEEN 2020 AND 2025
 GROUP BY 1,
          2
   HAVING count(p.year) < 6
       OR coalesce(sum(p.units_total), 0) = 0
namegeoidyrsu
Wayne County2922330
Dade County2905760
Hickory County2908500
Reynolds County2917960
Putnam County2917160
Sullivan County2921160
Shannon County2920360

data/turn-1-query-3.csv

Map Layer Queries
Units permitted 2020-2025 (all sizes) — colored by "cls": 5,000+ (#7a0177), 2,500-4,999 (#c51b8a), 1,000-2,499 (#f768a1), 250-999 (#fbb4b9), 1-249 (#feebe2), 0 (#ffffff), No data (#bdbdbd)
     WITH p AS (
             SELECT geoid,
                    sum(units_total) u,
                    sum(units_1) sf,
                    sum(units_2 + units_3_4) sm,
                    sum(units_5plus) mf5,
                    count(*) yrs
               FROM mo_bps_county_permits
              WHERE YEAR BETWEEN 2020 AND 2025
           GROUP BY geoid
          ),
          pop AS (
             SELECT geoid,
                    pop_estimate
               FROM mo_census_county_pop_est
              WHERE YEAR = 2025
          )
   SELECT c.geom,
          c.name AS "County",
          coalesce(p.u, 0) AS "Units 2020-2025",
          p.sf AS "Single-family units",
          p.sm AS "2-4 unit bldg units",
          p.mf5 AS "5+ unit bldg units",
          round(1000.0 * coalesce(p.u, 0) / pop.pop_estimate, 1) AS "Units per 1,000 residents(2025 pop)",
          coalesce(p.yrs, 0) AS "Years reported",
          CASE
                    WHEN p.yrs IS NULL THEN 'No data'
                    WHEN p.u = 0 THEN '0'
                    WHEN p.u < 250 THEN '1-249'
                    WHEN p.u < 1000 THEN '250-999'
                    WHEN p.u < 2500 THEN '1,000-2,499'
                    WHEN p.u < 5000 THEN '2,500-4,999'
                    ELSE '5,000+'
          END AS cls
     FROM mo_census_counties c
LEFT JOIN p USING (geoid)
LEFT JOIN pop USING (geoid)

Picture: maps/turn-1-county-permits-2020-2025.png

Used Data Sets

data/turn-1-query-1.csv

↑ Contents
yearnunitssfsmall_mfmf5
2020114198391310710645668
2021114213721394110736358
2022114209011159811788125
2023113167811102212094550
2024113184641152815995337
2025113174741137413344766

6 rows.

data/turn-1-query-2.csv

↑ Contents
namegeoidusfmf5yrspop_estimateper1kpopyr
Jackson County29095233871002711487673299431.92025
St. Charles County291831497289445685642649935.12025
St. Louis County2918973464827248869909117.42025
Greene County29077730951811873630928623.62025
Boone County29019543941781191619174628.42025
Cass County29037529333571382611585945.72025
Jasper County29097466530351042612742836.62025
Jefferson County2909945504255200623313219.52025
Christian County290433924338430769672540.62025
Franklin County2907136862651911610809034.12025
St. Louis city2951033975562767627814412.22025
Clay County29047287416061206626503210.82025
Taney County292132662221135065700146.72025
Warren County292192217160249163901656.82025
Camden County290292118151646164404748.12025
Platte County2916520461593299611440017.92025
Stone County29209149214093563250345.92025
St. Francois County29187116846853866780917.22025
Lincoln County29113110275122866667616.52025
Cole County290511011938067790813.02025

20 rows.

data/turn-1-query-3.csv

↑ Contents
namegeoidyrsu
Wayne County2922330
Dade County2905760
Hickory County2908500
Reynolds County2917960
Putnam County2917160
Sullivan County2921160
Shannon County2920360

7 rows.

charts/turn-1-mo-units-by-year.csv

↑ Contents
YearBuilding sizeUnits
20201 unit13107
20202-4 units1064
20205+ units5668
20211 unit13941
20212-4 units1073
20215+ units6358
20221 unit11598
20222-4 units1178
20225+ units8125
20231 unit11022
20232-4 units1209
20235+ units4550
20241 unit11528
20242-4 units1599
20245+ units5337
20251 unit11374
20252-4 units1334
20255+ units4766

18 rows.

provenance/mo_bps_county_permits.md

↑ Contents

Provenance: mo_bps_county_permits

This file describes how the rows in PostgreSQL table mo_bps_county_permits were obtained from an external source: where they were fetched and how fields were renamed and typed. Field meanings are in the mapping table below.

Identity
  • Table: mo_bps_county_permits
  • Family: BPS
  • Display name: Building Permits by County
  • Source URL: https://www2.census.gov/econ/bps/County/ (co<year>a.txt, 1990 on)
  • Geometry (source / stored): none / none
  • Update cycle: Yearly (each May)
Pipeline

The Building Permits Survey publishes one national county file per year, the annual summary (a), comma-delimited text with a two-row header. Every year from 1990 is loaded; the newest year is the one before the current, once the Bureau has published it. Each year's file is downloaded whole and kept; the sync keeps Missouri's rows (FIPS State 29) and checks each file's survey date names its year (2024, or 9099 in the 1990s files).

A county listed twice in one year (the 2014 and 2015 files repeat four Alaska boroughs and one Maryland county under a second name with the same estimates) keeps the row with more reported units; two rows with different estimates fail the sync. The monthly and year-to-date files are not loaded.

Changed from the source: cut to Missouri; reshaped to one row per county per year; the three totals added; the region, division and survey-date columns dropped (doc/BPS-SYNC.md).

No licence terms: a work of the U.S. Government, credited to the U.S. Census Bureau (doc/DATA-LICENSES.md).

Field → column mapping
Source fieldColumnTypeDescription
FIPS State, FIPS CountygeoidtextTwo digits and three, joined
County NamenametextTrailing spaces trimmed
Survey Dateyeartext → integerChecked against the file's year
1-unit Bldgs, Units, Valuebldgs_1, units_1, value_1integerEstimates with imputation
2-units Bldgs, Units, Valuebldgs_2, units_2, value_2integer
3-4 units Bldgs, Units, Valuebldgs_3_4, units_3_4, value_3_4integer
5+ units Bldgs, Units, Valuebldgs_5plus, units_5plus, value_5plusinteger
1-unit rep … 5+ units reprep_bldgs_1 … rep_value_5plusintegerReported only
(computed)bldgs_total, units_total, value_totalThe four estimate sizes added
Region Code, Division Code(dropped)

provenance/mo_census_counties.md

↑ Contents

Provenance: mo_census_counties

This file describes how the rows in PostgreSQL table mo_census_counties were obtained from an external source: where they were fetched and how fields were renamed and typed. Field meanings are in the mapping table below.

Identity
Pipeline

Two Census Bureau sources, joined on the county's 5-digit FIPS code:

  • Boundaries: TIGERweb tigerWMS_Current layer 82 ("Counties"), where=STATE='29', GeoJSON, outSR=4326, keyset-paged on GEOID.
  • CFS areas: sheet CFSAreas of the 2022 Commodity Flow Survey county list, the Missouri rows (ST = 29). Only the 2022 columns are kept.

The two must name the same counties, or the sync fails. FAF's mo_faf_county_xwalk is built from this table: each county's cfs_geoid is the CFS22_ID of one FAF6 zone.

Field → column mapping
Source fieldColumnTypeDescription
TIGER GEOIDgeoidvarchar(5)state + county FIPS
TIGER GEOID, last 3county_fipsvarchar(3)county FIPS
TIGER NAMEnamevarchar(60)e.g. St. Louis County
CFS CFS22_AREAcfs_areavarchar(5)CSA/MSA code, or 99999
CFS CFS22_TYPEcfs_area_typevarchar(1)C, M or R
CFS CFS22_NAME, whitespace collapsedcfs_area_namevarchar(120)the workbook pads some names with doubled and trailing spaces
CFS CFS22_GEOIDcfs_geoidvarchar(19)e.g. E330000US2947600000
TIGER AREALANDaland_m2bigintsquare meters
TIGER AREAWATERawater_m2bigintsquare meters
TIGER INTPTLATintptlatdouble precisioninternal point
TIGER INTPTLONintptlondouble precisioninternal point
geometrygeomgeometry(MultiPolygon, 4326)ST_Multi(ST_GeomFromGeoJSON)
Geometry
  • SRID 4326 (WGS84). GIST index on geom.
Change detection

The Census sync's check compares the layer's vintage ("January 1, 2026 vintage") and Missouri's row count, and the county list's Last-Modified and length. A change to either marks Census stale, and the next Census sync rebuilds this table, then FAF's crosswalk.

Attribution

US Census Bureau. TIGER products are free to use with acknowledgement of the U.S. Census Bureau as the source; the CFS county list states no terms.

provenance/mo_census_county_pop_est.md

↑ Contents

Provenance: mo_census_county_pop_est

This file describes how the rows in PostgreSQL table mo_census_county_pop_est were obtained from an external source: where they were fetched and how fields were renamed and typed. Field meanings are in the mapping table below.

Identity
  • Table: mo_census_county_pop_est
  • Family: Census
  • Display name: Annual Population Estimates by County
  • Source URL: https://www2.census.gov/programs-surveys/popest/datasets/2020-2025/counties/totals/co-est2025-alldata.csv (vintage 2025; each vintage <V> is 2020-<V>/counties/totals/co-est<V>-alldata.csv), for 2020 on
  • History (2000–2019): under the same datasets/ directory, 2000-2010/intercensal/county/co-est00int-tot.csv and 2010-2020/intercensal/county/asrh/cc-est2020int-agesex-all.csv (the revised population), 2010/2010-eval-estimates/co-est2010-alldata.csv and 2010-2020/counties/totals/co-est2020-alldata.csv (the components of change of the releases they revised)
  • History (1970–1999): under https://www2.census.gov/programs-surveys/popest/tables/, 1900-1980/counties/asrh/co-asr-7079.csv, 1980-1990/counties/asrh/pe-02-<year>.csv and 1990-2000/intercensal/st-co/stch-icen<year>.txt (the county age, sex and race estimates), and 1900-1980/counties/totals/e7079co.txt and 1980-1990/counties/totals/e8089co.txt (the decades' county totals tables, for their census counts)
  • Geometry (source / stored): none / none
  • Update cycle: Yearly (each March)
Pipeline

The Population Estimates Program's national county file, CSV, one row per county with a column per year for each figure. The sync keeps Missouri's county rows (SUMLEV 050, STATE 29), dropping the state's own total (040), and turns each into one row per year, the years read off the file's POPESTIMATE<year> columns. Every county the file names must be one the county layer of TIGERweb draws, or the sync fails. A file that is not valid UTF-8 is read as Latin-1. These rows are series postcensal.

The years before 2020 are series intercensal, from four further national files that never change:

  • Population, 2000–2009: co-est00int-tot.csv, one row per county, codes written without leading zeros (SUMLEV "50", STATE "1"), which the sync pads. ESTIMATESBASE2000 and POPESTIMATE2000–2009; its POPESTIMATE2010 and CENSUS2010POP are not loaded. vintage 2010.
  • Population, 2010–2019: the Bureau's table of revised county totals for the decade is a spreadsheet that names counties without codes, so the sync reads the same figures from cc-est2020int-agesex-all.csv, one row per county and YEAR code, its POPESTIMATE the whole population: YEAR 1 is the April 1, 2010 base, 2–11 July 1, 2010–2019, and 12 (the April 1, 2020 census) is not loaded. vintage 2020. 2010 is taken from this file, not the 2000s one, which has its own figure for it.
  • Components: the original releases' files, as published, matched by county code: co-est2010-alldata.csv for 2000–2010 (2000 is April to June) and co-est2020-alldata.csv for 2011–2019. Their natural change column is NATURALINC<year>. A county with no row in the 2000s release (one coded anew in the 2010s) has empty 2010 components; any other missing county fails the sync.
  • pop_change is computed, not read: pop_estimate less the row before's (2010's less the 2000s file's 2009, 2000's less 1999's, or ESTIMATESBASE2000 for a county with no 1999 row). The releases' NPOPCHG_<year> describes their own population, not the revised one, and is not loaded.
  • 1970–1999: each county's July 1 population is the sum of its age, sex and race estimates, which mo_census_county_pop_char loads from the same files (its provenance has their layouts): vintage 1980, 1990 and 2000 for the three decades. The Bureau's county totals tables for the 1970s and 1980s, e7079co.txt and e8089co.txt, are fixed-width text in blocks of five years, a long name wrapping onto a line of its own; only their first column, the decade's April 1 census, is loaded, into estimates_base on the 1970 and 1980 rows. Their July figures are not loaded: the 1970s table rounds counties to hundreds, and both are on the geography of their day as the age files are, but not always the same day's. No component of change is loaded before 2000. pop_change is computed as for the later decades, 1970's from the April 1970 count, and the 2000 row's is from July 1999.
  • A history row's county need not be one TIGER draws today (Connecticut's eight old counties, the 1970s' Alaskan census divisions and Virginia's Nansemond, and a handful elsewhere); the sync logs them.
Field → column mapping
Source fieldColumnTypeDescription
STATE + COUNTYgeoidvarchar(5)county FIPS
the <year> suffixyearsmallint
the newest <year>vintagesmallint1980, 1990, 2000, 2010 or 2020 on history rows
seriesvarchar(12)postcensal, or intercensal on history rows
POPESTIMATE<year>pop_estimateinteger
ESTIMATESBASE2020estimates_baseinteger2020 row only (ESTIMATESBASE2000, YEAR 1 on the 2000 and 2010 rows; the decade tables' census column on the 1970 and 1980 rows)
NPOPCHG<year>pop_changeintegercomputed on history rows
BIRTHS<year>birthsinteger
DEATHS<year>deathsinteger
NATURALCHG<year>natural_changeintegerNATURALINC<year> on history rows
INTERNATIONALMIG<year>international_miginteger
DOMESTICMIG<year>domestic_miginteger
NETMIG<year>net_miginteger
RESIDUAL<year>residualinteger
GQESTIMATES<year>gq_estimateinteger

The file's per-1,000 rate columns (R…) and GQESTIMATESBASE2020 are not loaded.

Geometry
  • No geometry column.
Change detection

The Census sync's check asks for the next vintage's file each time and moves to it once it is published; otherwise it compares the current file's Last-Modified and length, and each history file's. Any of them marks this table stale, and the next Census sync rebuilds it whole, every year from 2020 replaced by the new release.

Attribution

US Census Bureau, Population Estimates Program.

© 2026 State Planner