State Planner

New Mexico · November 5, 2026

Housing Units Permitted by County, 2020-2025

This is a real answer State Planner produced from New Mexico’s public data.

Ask this question, or one like it, in State Planner now. Sign up to try every feature free for 7 days, no card needed, and the question will be waiting in your new chat to change or send.

Ask this in State Planner →
  1. New Mexico Building Permits Issued by County: Where Is New Housing Going, 2020-2025?


    Where New Mexico's new housing permits went, 2020–2025

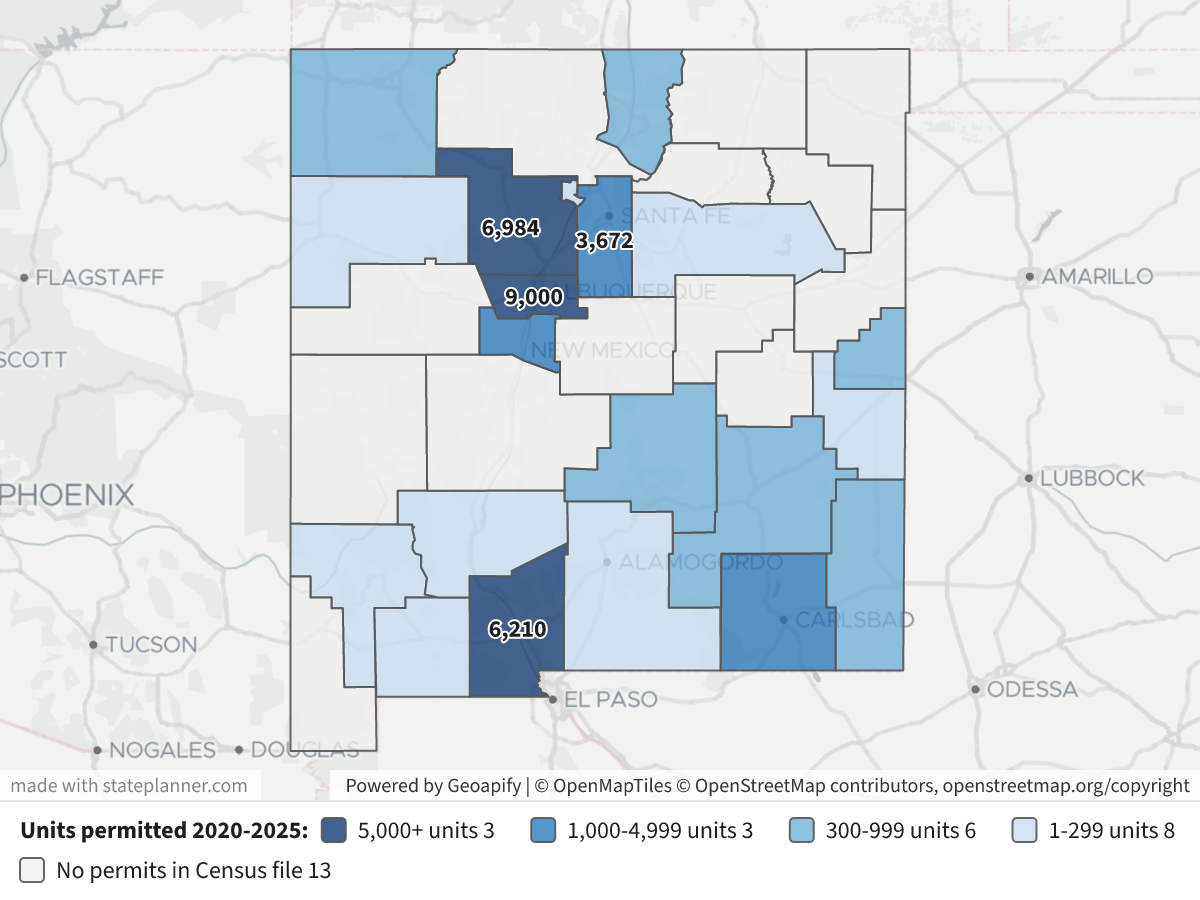
    Building permits authorized 45,435 new privately owned housing units in New Mexico from 2020 through 2025. These are Census Building Permits Survey estimates, which include the Bureau's figures for permit offices that didn't report. Four counties account for 78% of the units: Bernalillo, Sandoval, Doña Ana and Santa Fe.
    Housing Units Permitted by County, 2020-2025Housing Units Permitted by County, 2020-2025⬇ Image

    How to read the map: counties are shaded by the total units permitted from 2020 to 2025:

    • Dark navy: 5,000 or more
    • Blue: 1,000–4,999
    • Light blue: 300–999
    • Pale blue: 1–299
    • Grey: no permits in the Census county file

    The four largest totals are labelled on the map. Click a county to see how its units split by building size and its units per 1,000 residents.

    Housing units authorized by permit, by county, 2020–2025

    CountyUnitsShare of stateSingle-family2–4 unit bldgs5+ unit bldgsUnits per 1,000 residents*
    Bernalillo8,99827.0%5,206963,69613.5
    Sandoval6,98421.0%5,645921,24743.8
    Doña Ana6,21018.7%5,76628515927.1
    Santa Fe3,67211.0%1,443142,21523.4
    Valencia1,4454.3%1,4450017.6
    Eddy1,3754.1%9564137822.0
    Lea9883.0%9880013.2
    Curry8632.6%36228721418.5
    Taos7132.1%7014820.6
    San Juan6131.8%5920215.1
    Lincoln5131.5%5076025.9
    Chaves4861.5%486007.7
    Los Alamos1650.5%165008.5
    Roosevelt1340.4%134007.2
    Luna, Otero, McKinley, Sierra, Grant, San Miguel127 combined0.3%———0.1–2.0

    *Six-year units divided by the 2025 Census county population estimate.

    What stands out

    • Sandoval County (Rio Rancho and the Albuquerque metro's west side) permitted the most housing relative to its size: about 44 units per 1,000 residents, roughly three times Bernalillo's rate. Only Bernalillo permitted more units in total.
    • Two counties got most of the apartment permits. Statewide, about 81% of units were single-family and 17.5% were in buildings of five or more units. Bernalillo (3,696) and Santa Fe (2,215) together hold three-quarters of those larger-building units. Santa Fe is the only county where buildings of five or more units outnumber single-family homes (60% of its units).
    • Doña Ana (Las Cruces) is almost entirely single-family: 93% of its 6,210 units.
    • Outside the metro areas, the largest totals are in Eddy and Lea (the Permian Basin oil region) and in Valencia, south of Albuquerque. Lincoln and Taos have high rates for their size, at 21–26 units per 1,000 residents.

    Year by year

    Housing units permitted per year, top counties⬇ CSV⬇ Image

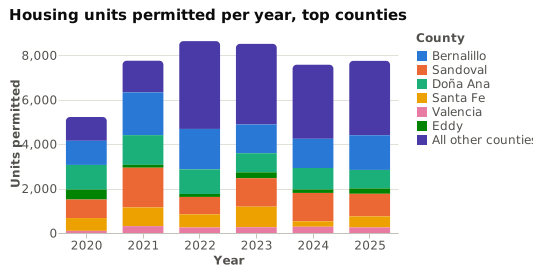
    The state total went from 5,219 units in 2020 to a peak of 8,633 in 2022. It stayed near that in 2023 (8,511), then settled around 7,600–7,700 in 2024 and 2025. The 2021 jump came mostly from buildings of five or more units, which rose from 760 units to 2,203. Single-family permits peaked in 2022 at 7,155.

    Caveats

    • Thirteen counties have no rows in the Census file for these years: Rio Arriba, Cibola, Socorro, Torrance, Colfax, Quay, Mora, Guadalupe, Union, Hidalgo, Catron, De Baca and Harding. Sierra appears in only 2 of the 6 years and Grant in 4. Missing rows most likely mean the area has few or no permit-issuing offices, so construction there isn't counted. They don't mean nothing was built.
    • Some housing isn't counted at all: manufactured (mobile) homes, public housing, additions and conversions are left out. That matters in rural New Mexico, where many new homes are manufactured homes.
    • A permit isn't a finished home: it authorizes construction, and some permitted units are never built.
    • About the dollar figures: construction values in the map pop-ups and the data are nominal dollars as written on the permits (for example about $1.8 billion in Bernalillo). They aren't adjusted for inflation and are rough for comparing counties.

    If you want to look below the county level, I can break this down by city or permit office (Albuquerque, Rio Rancho, Las Cruces, Santa Fe and others).

Layers

  • …
    • …
    • …
    • …
    • …
    • …

Click anything on the map for its details.

The transcript below the answer shows every query it ran. Shapefiles of every layer, at full detail, can be downloaded in State Planner: sign up to ask your own question and export any map.

Ask your own question about New Mexico

Send takes you to sign up (every feature free for 7 days, no card needed), or to sign in if you have an account. Your question will be waiting in your new chat.

Transcript

What follows is the transcript of this chat as State Planner generated it. It is here to show how the answer above was arrived at: every query State Planner ran, what each one returned, and where the data came from.

transcript.md

↑ Contents

State Planner chat · https://stateplanner.com

  • State: New Mexico (NM)
  • Started: November 5, 2026, 5:30 PM UTC
  • Runtime: 52 sec
  • Status: completed
Prompt

New Mexico Building Permits Issued by County: Where Is New Housing Going, 2020-2025?

Model: Anthropic: Claude Opus 5.5 (anthropic/claude-opus-5.5, via openrouter)

Response

Where New Mexico's new housing permits went, 2020–2025

Building permits authorized 45,435 new privately owned housing units in New Mexico from 2020 through 2025. These are Census Building Permits Survey estimates, which include the Bureau's figures for permit offices that didn't report. Four counties account for 78% of the units: Bernalillo, Sandoval, Doña Ana and Santa Fe.

Housing Units Permitted by County, 2020-2025

How to read the map: counties are shaded by the total units permitted from 2020 to 2025:

  • Dark navy: 5,000 or more
  • Blue: 1,000–4,999
  • Light blue: 300–999
  • Pale blue: 1–299
  • Grey: no permits in the Census county file

The four largest totals are labelled on the map. Click a county to see how its units split by building size and its units per 1,000 residents.

Housing units authorized by permit, by county, 2020–2025

CountyUnitsShare of stateSingle-family2–4 unit bldgs5+ unit bldgsUnits per 1,000 residents*
Bernalillo8,99827.0%5,206963,69613.5
Sandoval6,98421.0%5,645921,24743.8
Doña Ana6,21018.7%5,76628515927.1
Santa Fe3,67211.0%1,443142,21523.4
Valencia1,4454.3%1,4450017.6
Eddy1,3754.1%9564137822.0
Lea9883.0%9880013.2
Curry8632.6%36228721418.5
Taos7132.1%7014820.6
San Juan6131.8%5920215.1
Lincoln5131.5%5076025.9
Chaves4861.5%486007.7
Los Alamos1650.5%165008.5
Roosevelt1340.4%134007.2
Luna, Otero, McKinley, Sierra, Grant, San Miguel127 combined0.3%———0.1–2.0

*Six-year units divided by the 2025 Census county population estimate.

What stands out
  • Sandoval County (Rio Rancho and the Albuquerque metro's west side) permitted the most housing relative to its size: about 44 units per 1,000 residents, roughly three times Bernalillo's rate. Only Bernalillo permitted more units in total.
  • Two counties got most of the apartment permits. Statewide, about 81% of units were single-family and 17.5% were in buildings of five or more units. Bernalillo (3,696) and Santa Fe (2,215) together hold three-quarters of those larger-building units. Santa Fe is the only county where buildings of five or more units outnumber single-family homes (60% of its units).
  • Doña Ana (Las Cruces) is almost entirely single-family: 93% of its 6,210 units.
  • Outside the metro areas, the largest totals are in Eddy and Lea (the Permian Basin oil region) and in Valencia, south of Albuquerque. Lincoln and Taos have high rates for their size, at 21–26 units per 1,000 residents.
Year by year
Housing units permitted per year, top counties

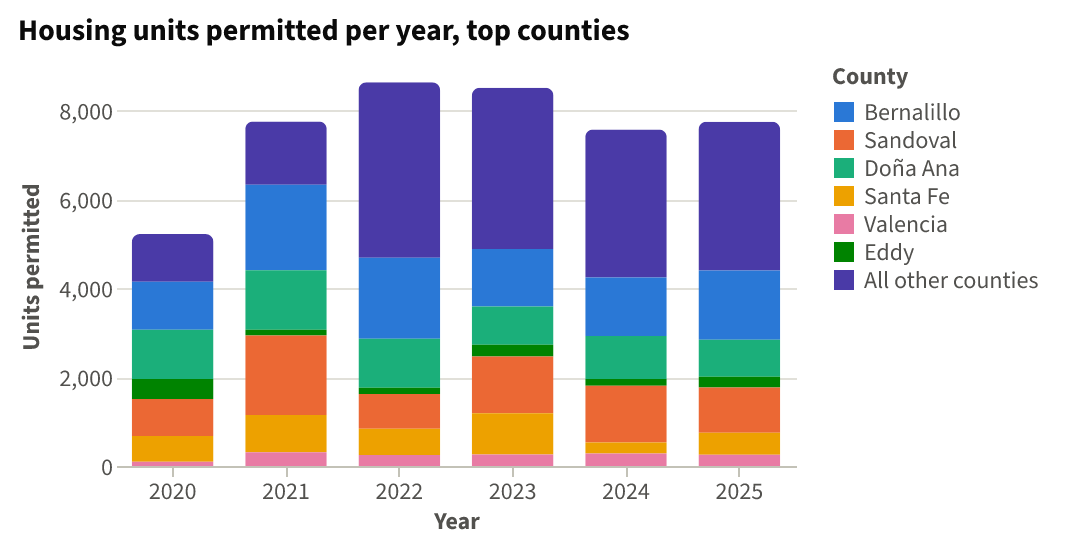
The state total went from 5,219 units in 2020 to a peak of 8,633 in 2022. It stayed near that in 2023 (8,511), then settled around 7,600–7,700 in 2024 and 2025. The 2021 jump came mostly from buildings of five or more units, which rose from 760 units to 2,203. Single-family permits peaked in 2022 at 7,155.

Caveats
  • Thirteen counties have no rows in the Census file for these years: Rio Arriba, Cibola, Socorro, Torrance, Colfax, Quay, Mora, Guadalupe, Union, Hidalgo, Catron, De Baca and Harding. Sierra appears in only 2 of the 6 years and Grant in 4. Missing rows most likely mean the area has few or no permit-issuing offices, so construction there isn't counted. They don't mean nothing was built.
  • Some housing isn't counted at all: manufactured (mobile) homes, public housing, additions and conversions are left out. That matters in rural New Mexico, where many new homes are manufactured homes.
  • A permit isn't a finished home: it authorizes construction, and some permitted units are never built.
  • About the dollar figures: construction values in the map pop-ups and the data are nominal dollars as written on the permits (for example about $1.8 billion in Bernalillo). They aren't adjusted for inflation and are rough for comparing counties.

If you want to look below the county level, I can break this down by city or permit office (Albuquerque, Rio Rancho, Las Cruces, Santa Fe and others).

Chart Queries
Housing units permitted per year, top counties
   SELECT YEAR AS "Year",
          CASE
                    WHEN geoid IN ('35001', '35043', '35013', '35049', '35061', '35015') THEN replace(replace(name, ' County', ''), 'Dona', 'Doña')
                    ELSE 'All other counties'
          END AS "County",
          sum(units_total) AS "Units permitted"
     FROM nm_bps_county_permits
    WHERE YEAR BETWEEN 2020 AND 2025
 GROUP BY 1,
          2
 ORDER BY 1,
          2

charts/turn-1-permits-by-year-county.csv

Picture: charts/turn-1-permits-by-year-county.png

Exploratory Queries
Query 1 — Check which years 2020-2025 exist and county coverage.
   SELECT YEAR,
          count(*),
          sum(units_total) u,
          sum(units_1) sf,
          sum(units_5plus) mf5
     FROM nm_bps_county_permits
    WHERE YEAR >= 2019
 GROUP BY YEAR
 ORDER BY YEAR
yearcountusfmf5
20192350204285702
20202152194418760
202121775354652203
202220863371551427
202320851168351529
20241975726488770
202519774762961264

data/turn-1-query-1.csv

Query 2 — County totals 2020-2025 with share, mix and per-1,000-resident rate.
     WITH p AS (
             SELECT geoid,
                    sum(units_total) u,
                    sum(units_1) sf,
                    sum(units_2 + units_3_4) small,
                    sum(units_5plus) mf,
                    count(*) yrs,
                    sum(value_total) val
               FROM nm_bps_county_permits
              WHERE YEAR BETWEEN 2020 AND 2025
           GROUP BY geoid
          ),
          pop AS (
             SELECT geoid,
                    pop_estimate
               FROM nm_census_county_pop_est
              WHERE YEAR = (
                       SELECT max(YEAR)
                         FROM nm_census_county_pop_est
                    )
          )
   SELECT c.geoid,
          c.name,
          p.u,
          p.sf,
          p.small,
          p.mf,
          p.yrs,
          round(p.val / 1e6) val_m,
          pop.pop_estimate,
          round(1000.0 * p.u / pop.pop_estimate, 1) per1k,
          round(100.0 * p.u / sum(p.u) OVER (), 1) pct
     FROM nm_census_counties c
LEFT JOIN p ON p.geoid = c.geoid
LEFT JOIN pop ON pop.geoid = c.geoid
 ORDER BY p.u DESC NULLS LAST
geoidnameusfsmallmfyrsval_mpop_estimateper1kpct
35001Bernalillo County899852069636966181966760113.527.0
35043Sandoval County698456459212476137515956543.821.0
35013Doña Ana County621057662851596158822909127.118.7
35049Santa Fe County36721443142215680415690723.411.0
35061Valencia County144514450064168201317.64.3
35015Eddy County13759564137863356250922.04.1
35025Lea County9889880062757474913.23.0
35009Curry County86336228721461804665518.52.6
35055Taos County7137014861913456420.62.1
35045San Juan County61359202161481203405.11.8
35027Lincoln County5135076062201984425.91.5
35005Chaves County48648600694633647.71.5
35028Los Alamos County16516500641194078.50.5
35041Roosevelt County13413400620186157.20.4
35029Luna County38380068254071.50.1
35035Otero County25250069703680.40.1
35031McKinley County25160964681190.40.1
35051Sierra County23170626113952.00.1
35017Grant County13130042272520.50.0
35047San Miguel County330061262600.10.0
35037Quay County8454
35039Rio Arriba County39832
35019Guadalupe County4343
35006Cibola County26807
35007Colfax County12184

25 out of 33 are listed here.

data/turn-1-query-2.csv

Query 3 — Confirm population estimate year used for per-capita rates.
   SELECT max(YEAR)
     FROM nm_census_county_pop_est
max
2025

data/turn-1-query-3.csv

Map Layer Queries
Units permitted 2020-2025 — colored by "cls": 5,000+ units (#08306b), 1,000-4,999 units (#2171b5), 300-999 units (#6baed6), 1-299 units (#c6dbef), No permits in Census file (#eeeeee)
     WITH p AS (
             SELECT geoid,
                    sum(units_total) u,
                    sum(units_1) sf,
                    sum(units_2 + units_3_4) small,
                    sum(units_5plus) mf
               FROM nm_bps_county_permits
              WHERE YEAR BETWEEN 2020 AND 2025
           GROUP BY geoid
          ),
          pop AS (
             SELECT geoid,
                    pop_estimate
               FROM nm_census_county_pop_est
              WHERE YEAR = 2025
          )
   SELECT c.geom,
          c.name AS "County",
          coalesce(p.u, 0) AS "Units permitted 2020-2025",
          p.sf AS "Single-family units",
          p.small AS "2-4 unit bldg units",
          p.mf AS "5+ unit bldg units",
          round(1000.0 * coalesce(p.u, 0) / pop.pop_estimate, 1) AS "Units per 1,000 residents(2025 pop)",
          CASE
                    WHEN p.u IS NULL THEN 'none'
                    WHEN p.u >= 5000 THEN 'a'
                    WHEN p.u >= 1000 THEN 'b'
                    WHEN p.u >= 300 THEN 'c'
                    WHEN p.u >= 1 THEN 'd'
          END AS cls
     FROM nm_census_counties c
LEFT JOIN p ON p.geoid = c.geoid
LEFT JOIN pop ON pop.geoid = c.geoid

Picture: maps/turn-1-county-permits-2020-2025.png

Used Data Sets

data/turn-1-query-1.csv

↑ Contents
yearcountusfmf5
20192350204285702
20202152194418760
202121775354652203
202220863371551427
202320851168351529
20241975726488770
202519774762961264

7 rows.

data/turn-1-query-2.csv

↑ Contents
geoidnameusfsmallmfyrsval_mpop_estimateper1kpct
35001Bernalillo County899852069636966181966760113.527.0
35043Sandoval County698456459212476137515956543.821.0
35013Doña Ana County621057662851596158822909127.118.7
35049Santa Fe County36721443142215680415690723.411.0
35061Valencia County144514450064168201317.64.3
35015Eddy County13759564137863356250922.04.1
35025Lea County9889880062757474913.23.0
35009Curry County86336228721461804665518.52.6
35055Taos County7137014861913456420.62.1
35045San Juan County61359202161481203405.11.8
35027Lincoln County5135076062201984425.91.5
35005Chaves County48648600694633647.71.5
35028Los Alamos County16516500641194078.50.5
35041Roosevelt County13413400620186157.20.4
35029Luna County38380068254071.50.1
35035Otero County25250069703680.40.1
35031McKinley County25160964681190.40.1
35051Sierra County23170626113952.00.1
35017Grant County13130042272520.50.0
35047San Miguel County330061262600.10.0
35037Quay County8454
35039Rio Arriba County39832
35019Guadalupe County4343
35006Cibola County26807
35007Colfax County12184
35053Socorro County15838
35011De Baca County1647
35057Torrance County16100
35059Union County3844
35003Catron County3827
35023Hidalgo County3929
35033Mora County4051
35021Harding County617

33 rows.

charts/turn-1-permits-by-year-county.csv

↑ Contents
YearCountyUnits permitted
2020All other counties1071
2020Bernalillo1084
2020Doña Ana1109
2020Eddy448
2020Sandoval834
2020Santa Fe577
2020Valencia96
2021All other counties1425
2021Bernalillo1924
2021Doña Ana1338
2021Eddy129
2021Sandoval1789
2021Santa Fe840
2021Valencia308
2022All other counties3949
2022Bernalillo1820
2022Doña Ana1105
2022Eddy137
2022Sandoval783
2022Santa Fe590
2022Valencia249
2023All other counties3626
2023Bernalillo1294
2023Doña Ana861
2023Eddy264
2023Sandoval1281
2023Santa Fe926
2023Valencia259
2024All other counties3332
2024Bernalillo1316
2024Doña Ana964
2024Eddy156
2024Sandoval1278
2024Santa Fe244
2024Valencia282
2025All other counties3348
2025Bernalillo1560
2025Doña Ana833
2025Eddy241
2025Sandoval1019
2025Santa Fe495
2025Valencia251

42 rows.

provenance/nm_bps_county_permits.md

↑ Contents

Provenance: nm_bps_county_permits

This file describes how the rows in PostgreSQL table nm_bps_county_permits were obtained from an external source: where they were fetched and how fields were renamed and typed. Field meanings are in the mapping table below.

Identity
  • Table: nm_bps_county_permits
  • Family: BPS
  • Display name: Building Permits by County
  • Source URL: https://www2.census.gov/econ/bps/County/ (co<year>a.txt, 1990 on)
  • Geometry (source / stored): none / none
  • Update cycle: Yearly (each May)
Pipeline

The Building Permits Survey publishes one national county file per year, the annual summary (a), comma-delimited text with a two-row header. Every year from 1990 is loaded; the newest year is the one before the current, once the Bureau has published it. Each year's file is downloaded whole and kept; the sync keeps New Mexico's rows (FIPS State 35) and checks each file's survey date names its year (2024, or 9099 in the 1990s files).

A county listed twice in one year (the 2014 and 2015 files repeat four Alaska boroughs and one Maryland county under a second name with the same estimates) keeps the row with more reported units; two rows with different estimates fail the sync. The monthly and year-to-date files are not loaded.

Changed from the source: cut to New Mexico; reshaped to one row per county per year; the three totals added; the region, division and survey-date columns dropped.

No licence terms: a work of the U.S. Government, credited to the U.S. Census Bureau.

Field → column mapping
Source fieldColumnTypeDescription
FIPS State, FIPS CountygeoidtextTwo digits and three, joined
County NamenametextTrailing spaces trimmed
Survey Dateyeartext → integerChecked against the file's year
1-unit Bldgs, Units, Valuebldgs_1, units_1, value_1integerEstimates with imputation
2-units Bldgs, Units, Valuebldgs_2, units_2, value_2integer
3-4 units Bldgs, Units, Valuebldgs_3_4, units_3_4, value_3_4integer
5+ units Bldgs, Units, Valuebldgs_5plus, units_5plus, value_5plusinteger
1-unit rep … 5+ units reprep_bldgs_1 … rep_value_5plusintegerReported only
(computed)bldgs_total, units_total, value_totalThe four estimate sizes added
Region Code, Division Code(dropped)

provenance/nm_census_counties.md

↑ Contents

Provenance: nm_census_counties

This file describes how the rows in PostgreSQL table nm_census_counties were obtained from an external source: where they were fetched and how fields were renamed and typed. Field meanings are in the mapping table below.

Identity
Pipeline

Two Census Bureau sources, joined on the county's 5-digit FIPS code:

  • Boundaries: TIGERweb tigerWMS_Current layer 82 ("Counties"), where=STATE='35', GeoJSON, outSR=4326, keyset-paged on GEOID.
  • CFS areas: sheet CFSAreas of the 2022 Commodity Flow Survey county list, the New Mexico rows (ST = 35). Only the 2022 columns are kept.

The two must name the same counties, or the sync fails. FAF's nm_faf_county_xwalk is built from this table: each county's cfs_geoid is the CFS22_ID of one FAF6 zone.

Field → column mapping
Source fieldColumnTypeDescription
TIGER GEOIDgeoidvarchar(5)state + county FIPS
TIGER GEOID, last 3county_fipsvarchar(3)county FIPS
TIGER NAMEnamevarchar(60)e.g. Bernalillo County
CFS CFS22_AREAcfs_areavarchar(5)CSA/MSA code, or 99999
CFS CFS22_TYPEcfs_area_typevarchar(1)C, M or R
CFS CFS22_NAME, whitespace collapsedcfs_area_namevarchar(120)the workbook pads some names with doubled and trailing spaces
CFS CFS22_GEOIDcfs_geoidvarchar(19)e.g. E330000US3599999999
TIGER AREALANDaland_m2bigintsquare meters
TIGER AREAWATERawater_m2bigintsquare meters
TIGER INTPTLATintptlatdouble precisioninternal point
TIGER INTPTLONintptlondouble precisioninternal point
geometrygeomgeometry(MultiPolygon, 4326)ST_Multi(ST_GeomFromGeoJSON)
Geometry
  • SRID 4326 (WGS84). GIST index on geom.
Change detection

The Census sync's check compares the layer's vintage ("January 1, 2026 vintage") and New Mexico's row count, and the county list's Last-Modified and length. A change to either marks Census stale, and the next Census sync rebuilds this table, then FAF's crosswalk.

Attribution

US Census Bureau. TIGER products are free to use with acknowledgement of the U.S. Census Bureau as the source; the CFS county list states no terms.

provenance/nm_census_county_pop_est.md

↑ Contents

Provenance: nm_census_county_pop_est

This file describes how the rows in PostgreSQL table nm_census_county_pop_est were obtained from an external source: where they were fetched and how fields were renamed and typed. Field meanings are in the mapping table below.

Identity
  • Table: nm_census_county_pop_est
  • Family: Census
  • Display name: Annual Population Estimates by County
  • Source URL: https://www2.census.gov/programs-surveys/popest/datasets/2020-2025/counties/totals/co-est2025-alldata.csv (vintage 2025; each vintage <V> is 2020-<V>/counties/totals/co-est<V>-alldata.csv), for 2020 on
  • History (2000–2019): under the same datasets/ directory, 2000-2010/intercensal/county/co-est00int-tot.csv and 2010-2020/intercensal/county/asrh/cc-est2020int-agesex-all.csv (the revised population), 2010/2010-eval-estimates/co-est2010-alldata.csv and 2010-2020/counties/totals/co-est2020-alldata.csv (the components of change of the releases they revised)
  • History (1970–1999): under https://www2.census.gov/programs-surveys/popest/tables/, 1900-1980/counties/asrh/co-asr-7079.csv, 1980-1990/counties/asrh/pe-02-<year>.csv and 1990-2000/intercensal/st-co/stch-icen<year>.txt (the county age, sex and race estimates), and 1900-1980/counties/totals/e7079co.txt and 1980-1990/counties/totals/e8089co.txt (the decades' county totals tables, for their census counts)
  • Geometry (source / stored): none / none
  • Update cycle: Yearly (each March)
Pipeline

The Population Estimates Program's national county file, CSV, one row per county with a column per year for each figure. The sync keeps New Mexico's county rows (SUMLEV 050, STATE 35), dropping the state's own total (040), and turns each into one row per year, the years read off the file's POPESTIMATE<year> columns. Every county the file names must be one the county layer of TIGERweb draws, or the sync fails. A file that is not valid UTF-8 is read as Latin-1. These rows are series postcensal.

The years before 2020 are series intercensal, from four further national files that never change:

  • Population, 2000–2009: co-est00int-tot.csv, one row per county, codes written without leading zeros (SUMLEV "50", STATE "1"), which the sync pads. ESTIMATESBASE2000 and POPESTIMATE2000–2009; its POPESTIMATE2010 and CENSUS2010POP are not loaded. vintage 2010.
  • Population, 2010–2019: the Bureau's table of revised county totals for the decade is a spreadsheet that names counties without codes, so the sync reads the same figures from cc-est2020int-agesex-all.csv, one row per county and YEAR code, its POPESTIMATE the whole population: YEAR 1 is the April 1, 2010 base, 2–11 July 1, 2010–2019, and 12 (the April 1, 2020 census) is not loaded. vintage 2020. 2010 is taken from this file, not the 2000s one, which has its own figure for it.
  • Components: the original releases' files, as published, matched by county code: co-est2010-alldata.csv for 2000–2010 (2000 is April to June) and co-est2020-alldata.csv for 2011–2019. Their natural change column is NATURALINC<year>. A county with no row in the 2000s release (one coded anew in the 2010s) has empty 2010 components; any other missing county fails the sync.
  • pop_change is computed, not read: pop_estimate less the row before's (2010's less the 2000s file's 2009, 2000's less 1999's, or ESTIMATESBASE2000 for a county with no 1999 row). The releases' NPOPCHG_<year> describes their own population, not the revised one, and is not loaded.
  • 1970–1999: each county's July 1 population is the sum of its age, sex and race estimates, which nm_census_county_pop_char loads from the same files (its provenance has their layouts): vintage 1980, 1990 and 2000 for the three decades. The Bureau's county totals tables for the 1970s and 1980s, e7079co.txt and e8089co.txt, are fixed-width text in blocks of five years, a long name wrapping onto a line of its own; only their first column, the decade's April 1 census, is loaded, into estimates_base on the 1970 and 1980 rows. Their July figures are not loaded: the 1970s table rounds counties to hundreds, and both are on the geography of their day as the age files are, but not always the same day's. No component of change is loaded before 2000. pop_change is computed as for the later decades, 1970's from the April 1970 count, and the 2000 row's is from July 1999.
  • A history row's county need not be one TIGER draws today (Connecticut's eight old counties, the 1970s' Alaskan census divisions and Virginia's Nansemond, and a handful elsewhere); the sync logs them.
Field → column mapping
Source fieldColumnTypeDescription
STATE + COUNTYgeoidvarchar(5)county FIPS
the <year> suffixyearsmallint
the newest <year>vintagesmallint1980, 1990, 2000, 2010 or 2020 on history rows
seriesvarchar(12)postcensal, or intercensal on history rows
POPESTIMATE<year>pop_estimateinteger
ESTIMATESBASE2020estimates_baseinteger2020 row only (ESTIMATESBASE2000, YEAR 1 on the 2000 and 2010 rows; the decade tables' census column on the 1970 and 1980 rows)
NPOPCHG<year>pop_changeintegercomputed on history rows
BIRTHS<year>birthsinteger
DEATHS<year>deathsinteger
NATURALCHG<year>natural_changeintegerNATURALINC<year> on history rows
INTERNATIONALMIG<year>international_miginteger
DOMESTICMIG<year>domestic_miginteger
NETMIG<year>net_miginteger
RESIDUAL<year>residualinteger
GQESTIMATES<year>gq_estimateinteger

The file's per-1,000 rate columns (R…) and GQESTIMATESBASE2020 are not loaded.

Geometry
  • No geometry column.
Change detection

The Census sync's check asks for the next vintage's file each time and moves to it once it is published; otherwise it compares the current file's Last-Modified and length, and each history file's. Any of them marks this table stale, and the next Census sync rebuilds it whole, every year from 2020 replaced by the new release.

Attribution

US Census Bureau, Population Estimates Program.

© 2026 State Planner