State Planner

Ohio · November 1, 2026

Local Road Pavement Condition by County

This is a real answer State Planner produced from Ohio’s public data.

Ask this question, or one like it, in State Planner now. Sign up to try every feature free for 7 days, no card needed, and the question will be waiting in your new chat to change or send.

Ask this in State Planner →
  1. Which Ohio Counties Have the Worst Local Road Pavement?


    Local road pavement condition by county (ODOT PCR, local system)

    I used ODOT's PCR (Local) table (oh_pcr_local). It holds the Pavement Condition Rating, a 0–100 score where lower means more distress, for about 12,000 miles of county, municipal and township roads in all 88 counties. I ranked counties two ways:

    • Average PCR weighted by mileage, so long segments count more than short ones.
    • Share of rated miles below PCR 55. On ODOT's scale that is "poor" or worse.

    Statewide, the mileage-weighted average is 82.1, and 4.7% of rated miles are below 55.
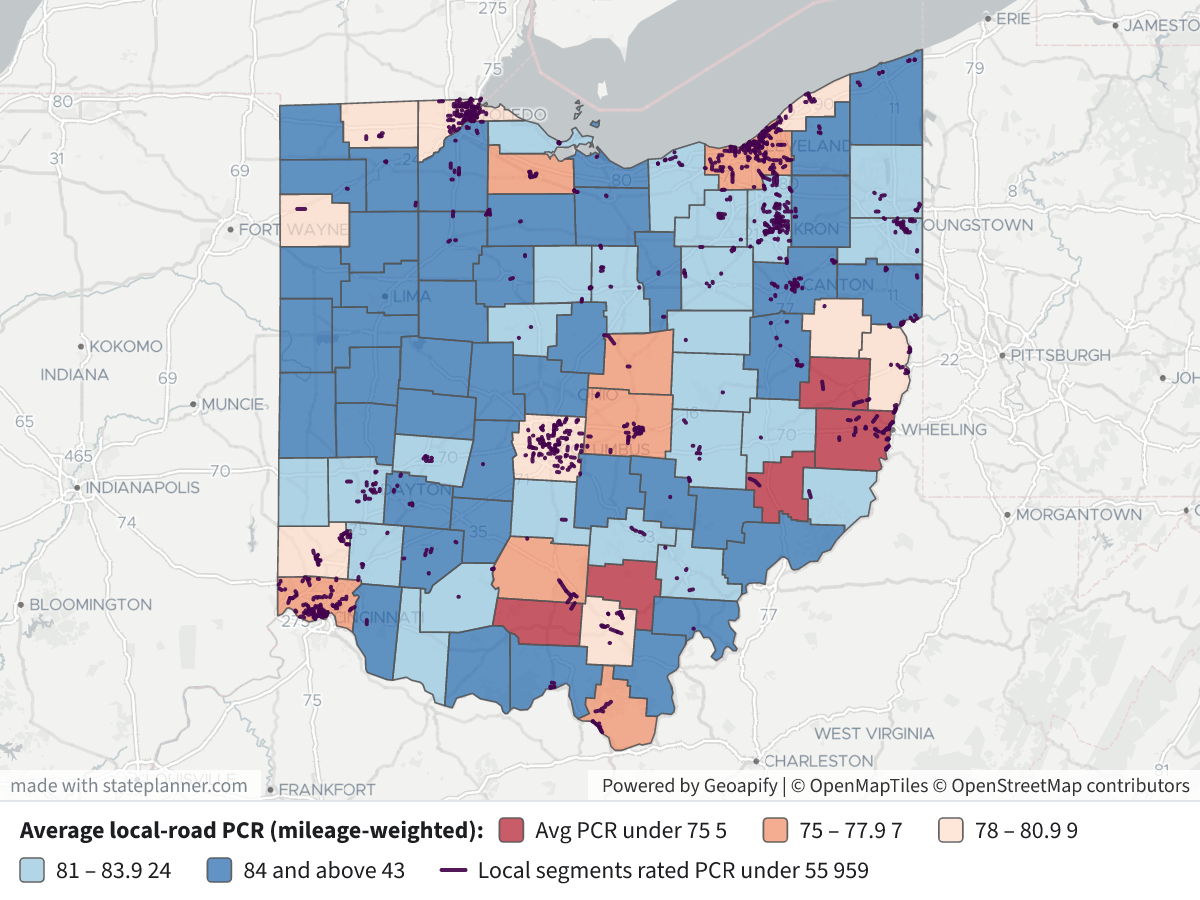
    Local Road Pavement Condition by CountyLocal Road Pavement Condition by County⬇ Image

    Counties with the lowest average local-road PCR

    CountyRated milesAvg PCR% of miles PCR < 55
    Vinton3870.40.0
    Noble1270.440.0
    Belmont11673.219.1
    Harrison4673.916.1
    Pike3874.87.0
    Cuyahoga79575.310.9
    Knox3375.618.3
    Ross11075.711.8
    Hamilton62875.87.8
    Licking21576.07.5
    Sandusky8876.16.5
    Lawrence9876.212.7

    Counties with at least 50 rated miles, by share below PCR 55: Belmont 19.1%, Jackson 13.5%, Lawrence 12.7%, Summit 12.0%, Ross 11.8%, Lucas 11.5%, Cuyahoga 10.9%, Hamilton 7.8%.

    What stands out

    • Belmont is low on both measures, with enough mileage (116 mi) to be a reliable reading. Nearby Harrison and Noble also score low, but they have few rated miles.
    • Among the large urban counties, Cuyahoga (75.3) and Hamilton (75.8) have the lowest averages. Together they have about 1,400 rated miles. Lucas and Summit have average scores near the middle, but more than 11% of their miles are below 55.
    • Some rankings rest on very few miles. Noble has 12 rated miles, Knox 33, and Vinton and Pike 38 each. One or two segments can move these counties a lot. Vinton's low average comes from many middling scores rather than any segment below 55.

    Map legend

    • County fill: mileage-weighted average PCR.
      • Dark red: under 75
      • Orange: 75–77.9
      • Light pink: 78–80.9
      • Light blue: 81–83.9
      • Dark blue: 84 and above
    • Dark purple lines: the 959 local segments rated below 55.
    • Click a county for its rated miles, share below 55 and rating dates. Click a segment for its route, city or township, PCR, roughness (IRI) and rating date.

    Caveats

    • Not every local road is rated. The table covers about 12,000 miles, mostly federal-aid-eligible routes (functional classes 2–7) rather than every residential street. How much is rated varies widely by county, and so does how reliable each county's figure is.
    • Ratings range from October 2020 to February 2026, so counties are not all measured at the same time. A county rated early may have repaved since.
    • The threshold and weighting are my choices. Lengths come from county log points, and "below 55" is my cut-off. Using below 65 instead, Noble, Harrison, Belmont and Ross have the highest shares (34–53%).

    I can also compare counties by road owner (county, city or township roads), rank cities or townships, or show the state-highway PCR beside these.

Layers

  • …
    • …
    • …
    • …
    • …
    • …
  • …

Click anything on the map for its details.

The transcript below the answer shows every query it ran. Shapefiles of every layer, at full detail, can be downloaded in State Planner: sign up to ask your own question and export any map.

Data sets used

Ask your own question about Ohio

Send takes you to sign up (every feature free for 7 days, no card needed), or to sign in if you have an account. Your question will be waiting in your new chat.

Transcript

What follows is the transcript of this chat as State Planner generated it. It is here to show how the answer above was arrived at: every query State Planner ran, what each one returned, and where the data came from.

transcript.md

↑ Contents

State Planner chat · https://stateplanner.com

  • State: Ohio (OH)
  • Started: November 1, 2026, 7:12 PM UTC
  • Runtime: 49 sec
  • Status: completed
Prompt

Which Ohio Counties Have the Worst Local Road Pavement?

Model: Anthropic: Claude Opus 5.5 (anthropic/claude-opus-5.5, via openrouter)

Response

Local road pavement condition by county (ODOT PCR, local system)

I used ODOT's PCR (Local) table (oh_pcr_local). It holds the Pavement Condition Rating, a 0–100 score where lower means more distress, for about 12,000 miles of county, municipal and township roads in all 88 counties. I ranked counties two ways:

  • Average PCR weighted by mileage, so long segments count more than short ones.
  • Share of rated miles below PCR 55. On ODOT's scale that is "poor" or worse.

Statewide, the mileage-weighted average is 82.1, and 4.7% of rated miles are below 55.

Local Road Pavement Condition by County

Counties with the lowest average local-road PCR

CountyRated milesAvg PCR% of miles PCR < 55
Vinton3870.40.0
Noble1270.440.0
Belmont11673.219.1
Harrison4673.916.1
Pike3874.87.0
Cuyahoga79575.310.9
Knox3375.618.3
Ross11075.711.8
Hamilton62875.87.8
Licking21576.07.5
Sandusky8876.16.5
Lawrence9876.212.7

Counties with at least 50 rated miles, by share below PCR 55: Belmont 19.1%, Jackson 13.5%, Lawrence 12.7%, Summit 12.0%, Ross 11.8%, Lucas 11.5%, Cuyahoga 10.9%, Hamilton 7.8%.

What stands out

  • Belmont is low on both measures, with enough mileage (116 mi) to be a reliable reading. Nearby Harrison and Noble also score low, but they have few rated miles.
  • Among the large urban counties, Cuyahoga (75.3) and Hamilton (75.8) have the lowest averages. Together they have about 1,400 rated miles. Lucas and Summit have average scores near the middle, but more than 11% of their miles are below 55.
  • Some rankings rest on very few miles. Noble has 12 rated miles, Knox 33, and Vinton and Pike 38 each. One or two segments can move these counties a lot. Vinton's low average comes from many middling scores rather than any segment below 55.

Map legend

  • County fill: mileage-weighted average PCR.
    • Dark red: under 75
    • Orange: 75–77.9
    • Light pink: 78–80.9
    • Light blue: 81–83.9
    • Dark blue: 84 and above
  • Dark purple lines: the 959 local segments rated below 55.
  • Click a county for its rated miles, share below 55 and rating dates. Click a segment for its route, city or township, PCR, roughness (IRI) and rating date.

Caveats

  • Not every local road is rated. The table covers about 12,000 miles, mostly federal-aid-eligible routes (functional classes 2–7) rather than every residential street. How much is rated varies widely by county, and so does how reliable each county's figure is.
  • Ratings range from October 2020 to February 2026, so counties are not all measured at the same time. A county rated early may have repaved since.
  • The threshold and weighting are my choices. Lengths come from county log points, and "below 55" is my cut-off. Using below 65 instead, Noble, Harrison, Belmont and Ross have the highest shares (34–53%).

I can also compare counties by road owner (county, city or township roads), rank cities or townships, or show the state-highway PCR beside these.

Exploratory Queries
Query 1 — Understand year coverage, rated mileage and counties in local PCR data.
   SELECT pcr_year,
          count(*) n,
          count(DISTINCT county_cd) counties,
          round(sum(ctl_end - ctl_begin)::numeric) miles,
          round(avg(pcr_nbr), 1) avg_pcr,
          count(*) FILTER (
              WHERE pcr_nbr IS NULL
          ) nulls
     FROM oh_pcr_local
 GROUP BY 1
 ORDER BY 1
pcr_yearncountiesmilesavg_pcrnulls
202616316881201180.90

data/turn-1-query-1.csv

Query 2 — Check jurisdiction, route type and direction mix of rated local segments.
   SELECT jurisdiction,
          route_type,
          direction_cd,
          count(*) n,
          round(sum(ctl_end - ctl_begin)::numeric) miles,
          round(avg(pcr_nbr), 1) avg_pcr
     FROM oh_pcr_local
 GROUP BY 1,
          2,
          3
 ORDER BY n DESC
    LIMIT 20
jurisdictionroute_typedirection_cdnmilesavg_pcr
CCRUP8156790383.0
MMRUP6469305278.0
TTRUP131778682.8
MMRDOWN20013779.5
CCRDOWN16112882.8
TTRDOWN13688.0

data/turn-1-query-2.csv

Query 3 — Rank counties by mileage-weighted local-road PCR and share of miles rated below 55.
     WITH s AS (
             SELECT county_cd,
                    greatest(ctl_end - ctl_begin, 0) mi,
                    pcr_nbr
               FROM oh_pcr_local
          )
   SELECT c.county,
          s.county_cd,
          round(sum(mi)::numeric, 0) miles,
          count(*) segs,
          round((sum(mi * pcr_nbr) / nullif(sum(mi), 0))::numeric, 1) wpcr,
          round(
          (
          100 * sum(mi) FILTER (
              WHERE pcr_nbr < 55
          ) / sum(mi)
          )::numeric,
          1
          ) pct_lt55,
          round(
          (
          100 * sum(mi) FILTER (
              WHERE pcr_nbr < 65
          ) / sum(mi)
          )::numeric,
          1
          ) pct_lt65
     FROM s
     JOIN oh_county c USING (county_cd)
 GROUP BY 1,
          2
 ORDER BY wpcr
    LIMIT 20
countycounty_cdmilessegswpcrpct_lt55pct_lt65
VINTONVIN381970.46.6
NOBLENOB12870.440.053.2
BELMONTBEL11615873.219.134.4
HARRISONHAS462373.916.139.4
PIKEPIK383374.87.017.8
CUYAHOGACUY795120275.310.925.7
KNOXKNO334175.618.326.0
ROSSROS11010775.711.833.2
HAMILTONHAM628119875.87.825.4
LICKINGLIC21528676.07.521.7
SANDUSKYSAN8812576.16.524.9
LAWRENCELAW989576.212.717.9
FRANKLINFRA998157078.05.519.2
JEFFERSONJEF11116478.27.321.0
LUCASLUC44772878.911.521.9
PAULDINGPAU412879.46.711.9
JACKSONJAC749280.113.514.6
LAKELAK15921280.36.022.1
FULTONFUL11710380.62.411.1
BUTLERBUT27341880.65.218.3

data/turn-1-query-3.csv

Query 4 — Check rating dates, functional classes and statewide totals for context.
   SELECT min(rated_date)::date mind,
          max(rated_date)::date maxd,
          round(
          (
          sum(greatest(ctl_end - ctl_begin, 0) * pcr_nbr) / sum(greatest(ctl_end - ctl_begin, 0))
          )::numeric,
          1
          ) wpcr,
          round(
          (
          100 * sum(greatest(ctl_end - ctl_begin, 0)) FILTER (
              WHERE pcr_nbr < 55
          ) / sum(greatest(ctl_end - ctl_begin, 0))
          )::numeric,
          1
          ) pct55,
          string_agg(DISTINCT functional_class, ',') fcs,
          min(pcr_nbr),
          max(pcr_nbr)
     FROM oh_pcr_local
mindmaxdwpcrpct55fcsminmax
2020-10-14T00:00:00.000Z2026-02-19T00:00:00.000Z82.14.72,3,4,5,6,70100

data/turn-1-query-4.csv

Query 5 — Rank counties with at least 50 rated miles by share of miles below PCR 55.
     WITH s AS (
             SELECT county_cd,
                    greatest(ctl_end - ctl_begin, 0) mi,
                    pcr_nbr
               FROM oh_pcr_local
          )
   SELECT c.county,
          round(sum(mi)::numeric) miles,
          round((sum(mi * pcr_nbr) / sum(mi))::numeric, 1) wpcr,
          round(
          (
          100 * coalesce(
          sum(mi) FILTER (
              WHERE pcr_nbr < 55
          ),
          0
          ) / sum(mi)
          )::numeric,
          1
          ) p55
     FROM s
     JOIN oh_county c USING (county_cd)
 GROUP BY 1
   HAVING sum(mi) >= 50
 ORDER BY p55 DESC
    LIMIT 10
countymileswpcrp55
BELMONT11673.219.1
JACKSON7480.113.5
LAWRENCE9876.212.7
SUMMIT49081.512.0
ROSS11075.711.8
LUCAS44778.911.5
CUYAHOGA79575.310.9
HAMILTON62875.87.8
LICKING21576.07.5
JEFFERSON11178.27.3

data/turn-1-query-5.csv

Map Layer Queries
Average local-road PCR (mileage-weighted) — colored by "bin": Avg PCR under 75 (#b2182b), 75 – 77.9 (#ef8a62), 78 – 80.9 (#fddbc7), 81 – 83.9 (#92c5de), 84 and above (#2166ac)
     WITH s AS (
             SELECT county_cd,
                    greatest(ctl_end - ctl_begin, 0) mi,
                    pcr_nbr,
                    rated_date
               FROM oh_pcr_local
          ),
          a AS (
             SELECT county_cd,
                    sum(mi) miles,
                    count(*) segs,
                    sum(mi * pcr_nbr) / nullif(sum(mi), 0) wpcr,
                    100 * coalesce(
                    sum(mi) FILTER (
                        WHERE pcr_nbr < 55
                    ),
                    0
                    ) / nullif(sum(mi), 0) p55,
                    min(rated_date)::date d0,
                    max(rated_date)::date d1
               FROM s
           GROUP BY 1
          )
   SELECT c.geom,
          initcap(c.county) AS "County",
          round(a.wpcr::numeric, 1) AS "Avg PCR(mile-weighted)",
          round(a.p55::numeric, 1) AS "% of rated miles PCR < 55",
          round(a.miles::numeric) AS "Rated miles",
          a.segs AS "Rated segments",
          a.d0 || ' to ' || a.d1 AS "Rating dates",
          CASE
                    WHEN a.wpcr < 75 THEN 'a'
                    WHEN a.wpcr < 78 THEN 'b'
                    WHEN a.wpcr < 81 THEN 'c'
                    WHEN a.wpcr < 84 THEN 'd'
                    ELSE 'e'
          END AS bin
     FROM oh_county c
     JOIN a USING (county_cd)

Picture: maps/turn-1-local-pcr-county.png

Local segments rated PCR under 55
   SELECT geom,
          county_cd AS "County code",
          route_type || ' ' || route_nbr || coalesce(route_suffix, '') AS "Route",
          coalesce(city_name, township_name) AS "City / township",
          pcr_nbr AS "PCR",
          avg_iri AS "Avg IRI",
          rated_date::date AS "Rated",
          round((ctl_end - ctl_begin)::numeric, 2) AS "Miles"
     FROM oh_pcr_local
    WHERE pcr_nbr < 55

Picture: maps/turn-1-local-pcr-county.png

Used Data Sets

data/turn-1-query-1.csv

↑ Contents
pcr_yearncountiesmilesavg_pcrnulls
202616316881201180.90

1 row.

data/turn-1-query-2.csv

↑ Contents
jurisdictionroute_typedirection_cdnmilesavg_pcr
CCRUP8156790383.0
MMRUP6469305278.0
TTRUP131778682.8
MMRDOWN20013779.5
CCRDOWN16112882.8
TTRDOWN13688.0

6 rows.

data/turn-1-query-3.csv

↑ Contents
countycounty_cdmilessegswpcrpct_lt55pct_lt65
VINTONVIN381970.46.6
NOBLENOB12870.440.053.2
BELMONTBEL11615873.219.134.4
HARRISONHAS462373.916.139.4
PIKEPIK383374.87.017.8
CUYAHOGACUY795120275.310.925.7
KNOXKNO334175.618.326.0
ROSSROS11010775.711.833.2
HAMILTONHAM628119875.87.825.4
LICKINGLIC21528676.07.521.7
SANDUSKYSAN8812576.16.524.9
LAWRENCELAW989576.212.717.9
FRANKLINFRA998157078.05.519.2
JEFFERSONJEF11116478.27.321.0
LUCASLUC44772878.911.521.9
PAULDINGPAU412879.46.711.9
JACKSONJAC749280.113.514.6
LAKELAK15921280.36.022.1
FULTONFUL11710380.62.411.1
BUTLERBUT27341880.65.218.3

20 rows.

data/turn-1-query-4.csv

↑ Contents
mindmaxdwpcrpct55fcsminmax
2020-10-14T00:00:00.000Z2026-02-19T00:00:00.000Z82.14.72,3,4,5,6,70100

1 row.

data/turn-1-query-5.csv

↑ Contents
countymileswpcrp55
BELMONT11673.219.1
JACKSON7480.113.5
LAWRENCE9876.212.7
SUMMIT49081.512.0
ROSS11075.711.8
LUCAS44778.911.5
CUYAHOGA79575.310.9
HAMILTON62875.87.8
LICKING21576.07.5
JEFFERSON11178.27.3

10 rows.

provenance/oh_county.md

↑ Contents

Provenance: oh_county

This file describes how the rows in PostgreSQL table oh_county were obtained from an external source: where they were fetched and how fields were renamed and typed. Field meanings are in the mapping table below.

Identity
Pipeline (TIMS family)

Ohio DOT TIMS publishes this layer on the TIMS data page. The catalog behind that page is GET https://tims.dot.state.oh.us/tims/api/glossary. Each entry names a MapServer layer URL.

Data is fetched as GeoJSON from that layer's REST query endpoint (where=1=1, outFields=*, outSR=4326, f=geojson), paginated with resultOffset / resultRecordCount. GeoJSON was chosen over the portal's CSV/SHP/GDB/KMZ exports because it keeps full attribute names, keeps geometry, and loads into PostGIS via ST_GeomFromGeoJSON.

Esri field names become lowercase snake_case PostgreSQL columns (non [a-z0-9_] → _). Dates stored as Esri epoch-milliseconds become timestamptz. Geometry is ST_SetSRID(ST_GeomFromGeoJSON(…), 4326), wrapped in ST_Multi when the table's stored type is Multi*. Esri shape-area / shape-length system fields are dropped.

The same MapServer query is used whenever the table is refreshed.

Field → column mapping
Source fieldColumnEsri typeDescription
OBJECTIDobjectidesriFieldTypeOID
COUNTY_CDcounty_cdesriFieldTypeStringThe 3-letter code of the county within Ohio (88 counties total) [ODOT]
COUNTYcountyesriFieldTypeStringCounty name [ODOT]
COUNTY_SEATcounty_seatesriFieldTypeStringCity that serves as the County seat [ODOT]
ODOT_DISTRICTodot_districtesriFieldTypeSmallIntegerFrom 1-12 plus Central Office – the counties are grouped into districts in Ohio for ease of maintenance and funding [ODOT]
FIPS_COUNTY_CDfips_county_cdesriFieldTypeStringFIPS County Code (Federal Information Processing Standard) [ODOT]
POP_2020pop_2020esriFieldTypeInteger
POP_2010pop_2010esriFieldTypeIntegerCounty population in 2010
POP_2000pop_2000esriFieldTypeIntegerCounty population in 2000
POP_1990pop_1990esriFieldTypeIntegerCounty population in 1990
STATE_PLANE_ZONEstate_plane_zoneesriFieldTypeStringState plane zone in which the county falls, N - North or S - South
ELEVATION_MAXIMUMelevation_maximumesriFieldTypeSmallIntegerMaximum elevation within the County boundaries
ELEVATION_MINIMUMelevation_minimumesriFieldTypeSmallIntegerMinimum elevation within the County boundaries
LAT_NORTH_DDlat_north_ddesriFieldTypeDouble
LAT_SOUTH_DDlat_south_ddesriFieldTypeDouble
LONG_EAST_DDlong_east_ddesriFieldTypeDouble
LONG_WEST_DDlong_west_ddesriFieldTypeDouble
AREA_SQMIarea_sqmiesriFieldTypeDouble
AREA_IDarea_idesriFieldTypeInteger
(feature geometry)geomST_Multi(ST_SetSRID(ST_GeomFromGeoJSON(…), 4326))Feature geometry, WGS84
Geometry
  • SRID 4326 (WGS84). GIST index on geom.
  • Empty / null geometries stored as SQL NULL.

provenance/oh_pcr_local.md

↑ Contents

Provenance: oh_pcr_local

This file describes how the rows in PostgreSQL table oh_pcr_local were obtained from an external source: where they were fetched and how fields were renamed and typed. Field meanings are in the mapping table below.

Identity
Pipeline (TIMS family)

Ohio DOT TIMS publishes this layer on the TIMS data page. The catalog behind that page is GET https://tims.dot.state.oh.us/tims/api/glossary. Each entry names a MapServer layer URL.

Data is fetched as GeoJSON from that layer's REST query endpoint (where=1=1, outFields=*, outSR=4326, f=geojson), paginated with resultOffset / resultRecordCount. GeoJSON was chosen over the portal's CSV/SHP/GDB/KMZ exports because it keeps full attribute names, keeps geometry, and loads into PostGIS via ST_GeomFromGeoJSON.

Esri field names become lowercase snake_case PostgreSQL columns (non [a-z0-9_] → _). Dates stored as Esri epoch-milliseconds become timestamptz. Geometry is ST_SetSRID(ST_GeomFromGeoJSON(…), 4326), wrapped in ST_Multi when the table's stored type is Multi*. Esri shape-area / shape-length system fields are dropped.

The same MapServer query is used whenever the table is refreshed.

Field → column mapping
Source fieldColumnEsri typeDescription
OBJECTIDobjectidesriFieldTypeOID
PCR_HISTORY_IDpcr_history_idesriFieldTypeStringPCR History ID
PCR_YEARpcr_yearesriFieldTypeIntegerYear in which conditions of pavements on road in speed zone were last collected and processed by the pavement engineering group
PERP_YEARperp_yearesriFieldTypeIntegerCalendar year in which a RI event occurs (like new constructions, abandoning of roads, annexations, increase in speed limit, and so on) on a roadway and is recorded in ODOT’s RI database
RATED_DATErated_dateesriFieldTypeDateDate the roadway was rated
ODOT_DISTRICTodot_districtesriFieldTypeStringFrom 1-12 plus Central Office – the counties are grouped into districts in Ohio for ease of maintenance and funding
COUNTY_CDcounty_cdesriFieldTypeStringThe 3-letter code of the county within Ohio (88 counties total)
NLFIDnlfidesriFieldTypeStringPrimary key field that allows ODOT’s graphic roadway network geometric segments to be linked to business data attributes
JURISDICTIONjurisdictionesriFieldTypeStringOne-letter code indicating the primary legal authority of the speed zone - one component of the NLFID
ROUTE_TYPEroute_typeesriFieldTypeStringTwo letter code indicating the basic transportation grouping or system that the speed zone belongs to- third component of the NLFID
ROUTE_NBRroute_nbresriFieldTypeStringRoute number associated with the section of the route
ROUTE_SUFFIXroute_suffixesriFieldTypeStringSingle letter used with the route number in local and municipal systems to guarantee uniqueness
DIRECTION_CDdirection_cdesriFieldTypeStringDirection Code
CTL_BEGINctl_beginesriFieldTypeDoubleLogpoint County Begin Number – the location within the county where the route begins
CTL_ENDctl_endesriFieldTypeDoubleLogpoint County End Number – the location within the county where the route ends
DIVIDED_HWYdivided_hwyesriFieldTypeStringIndicates whether a roadway section is part of a divided highway
FUNCTIONAL_CLASSfunctional_classesriFieldTypeStringThe organization of roadways into a hierarchy based on the character of service provided. Typical classifications include arterial, local, and collector roadways.
URBAN_AREA_CODEurban_area_codeesriFieldTypeStringU.S. Census Urban Area Code associated with the section of roadway
AREA_TYPEarea_typeesriFieldTypeStringWhen URBAN_AREA_CODE = '99999' then area type is 'RURAL'; When URBAN_AREA_CODE is less than '99999' then area type is 'URBAN'
HPMS_SAMPLE_IDhpms_sample_idesriFieldTypeStringSystem used by FHWA to collect roadway data from each state to facilitate consistent reporting on the condition and performance of the nation's highways
LANESlanesesriFieldTypeIntegerNumber of lanes in both directions carrying through traffic
MAINTENANCE_AUTHORITYmaintenance_authorityesriFieldTypeStringEntity who maintains roadway section; For code descriptions, please refer to the Roadway Information Manual
ACCESS_CONTROLaccess_controlesriFieldTypeStringDegree of access control for a given section of the road
NHSnhsesriFieldTypeStringIndicates if the record is included in the National Highway System, a federally designated network of roads, most of which already exist, that are eligible for priority federal aid funding; includes the Interstate system and major State highways
PRIORITY_SYSTEMpriority_systemesriFieldTypeStringPriority System code associated with the section of the roadway; G-General, P-Priority System, U-Urban
BASE_TYPEbase_typeesriFieldTypeStringCode indicating type of base material on roadway segment associated with record, please reference Roadway Information manual
SURFACE_TYPEsurface_typeesriFieldTypeStringRoadway top layer, i.e., Brick (B), Concrete (D), Bituminouse Concrete Road (G), Bitumminous Cold Mix Road (K), Chipseal or Micro (L), Gravel (M), Right-of-way Only (X)
PAVE_TYPEpave_typeesriFieldTypeStringPavement type as used in the Pavement Condition Rating Process i.e. Composite, Flexible
SURFACE_WIDTHsurface_widthesriFieldTypeIntegerThe surface width on the right side of the roadway traveling in the cardinal direction. This number indicates only the width of the driving lanes right of the centerline
ROADWAY_WIDTH_NBRroadway_width_nbresriFieldTypeIntegerThe entire width of the roadway, including all driving lanes and shoulders. This number could include some gravel shoulders. Does not include medians
PCR_NBRpcr_nbresriFieldTypeIntegerPavement Condition Rating Number on a scale of 0 to 100 with 100 being new pavement not open to traffic
TOT_PCR_DEDUCT_NBRtot_pcr_deduct_nbresriFieldTypeDoubleThe sum of the individul distress deducts calculated from the Pavement Condition Rating
TOT_STRUCT_DEDUCT_NBRtot_struct_deduct_nbresriFieldTypeDoubleThe sum of the individual distresses that are structural in nature from the Pavement Condition Rating Calculation
TOT_CRACK_DEDUCT_NBRtot_crack_deduct_nbresriFieldTypeDoubleThe sum of the individual crack distress deducts calculated from the Pavement Conditon Rating Calculation
TOT_RUT_DEDUCT_NBRtot_rut_deduct_nbresriFieldTypeDoubleThe sum of the rut distress deduct calculated from the Pavement Condtion Rating Calculation
BASE_FAILUREbase_failureesriFieldTypeStringAny deviation of the pavement surface from its original shape (other than described for rutting ). This deformation may take the form of bumps, dips, lipping or stepping at cracks, all of which give rise to pitch, roll and jarring drop in a moving vehicle
BASE_FAILURE_VALUEbase_failure_valueesriFieldTypeSingleValue of the deduct associated with the Distress
BLEEDINGbleedingesriFieldTypeStringFlushing of excess asphalt binder on the surface of the pavement
BLEEDING_VALUEbleeding_valueesriFieldTypeSingleValue of the deduct associated with the Distress
BLOCK_TRANS_CRKblock_trans_crkesriFieldTypeStringCracking that is formed by interconcected transversed and longitudinal cracking
BLOCK_TRANS_CRK_VALUEblock_trans_crk_valueesriFieldTypeSingleValue of the deduct associated with the Distress
BRICK_DETERIORATIONbrick_deteriorationesriFieldTypeStringThe breaking up, disintegration¸ or loss of bricks
BRICK_DETER_VALUEbrick_deter_valueesriFieldTypeSingleValue of the deduct associated with the Distress
CORNER_BREAKcorner_breakesriFieldTypeStringA crack in jointed concrete pavement that intersects transverse joints or cracks and a longitudinal edge diagonally. To be considered a corner break, the leg size of the triangular break must be greater than 12 inches.
CORNER_BREAK_VALUEcorner_break_valueesriFieldTypeSingleValue of the deduct associated with the Distress
CORRUGATIONcorrugationesriFieldTypeStringCorrugations refers to the ride quality of various brick pavers. Pavers with very narrow and tight joints and a level surface may have a very smooth ride and minor traffic noise. Pavers with some settlement, open joints, and a rough, uneven surface can produce a very rough ride and significant traffic noise.
CORRUGATION_VALUEcorrugation_valueesriFieldTypeSingleValue of the deduct associated with the Distress
CROWNcrownesriFieldTypeStringThe crown of the road refers to the center of the road being higher than the shoulders.
CROWN_VALUEcrown_valueesriFieldTypeSingleValue of the deduct associated with the Distress
CRACK_SEAL_DEFICIENCYcrack_seal_deficiencyesriFieldTypeStringCrack seal deficiency is crack seal which is no longer effective in preventing intrusion of water or cracks which have never been sealed.
CRACK_SEAL_DEF_VALUEcrack_seal_def_valueesriFieldTypeSingleValue of the deduct associated with the Distress
DISCOLORATIONdiscolorationesriFieldTypeStringThe fading of the initial brick color.
DISCOLORATION_VALUEdiscoloration_valueesriFieldTypeSingleValue of the deduct associated with the Distress
DRAINAGEdrainageesriFieldTypeStringA system such as roadside ditches, culverts, etc., used to remove surface water on the roadway
DRAINAGE_VALUEdrainage_valueesriFieldTypeSingleValue of the deduct associated with the Distress
DUSTdustesriFieldTypeStringSoil and other fines that become airborne under the action traffic over a gravel surface
DUST_VALUEdust_valueesriFieldTypeSingleValue of the deduct associated with the Distress
EDGE_CRACKINGedge_crackingesriFieldTypeStringEdge cracks are longitudinal or crescent shaped cracks found within 1 foot
EDGE_CRACKING_VALUEedge_cracking_valueesriFieldTypeSingle(0.3 m) of the pavement edge line
FAULTINGfaultingesriFieldTypeStringThe difference in elevation between abutting slabs at transverse joints or cracks in concrete pavements
FAULTING_VALUEfaulting_valueesriFieldTypeSingleValue of the deduct associated with the Distress
GRAVEL_LAYERgravel_layeresriFieldTypeStringCombination of stone, sand, and other material used as the top surface of a roadway
GRAVEL_LAYER_VALUEgravel_layer_valueesriFieldTypeSingleValue of the deduct associated with the Distress
JOINT_REF_CRKjoint_ref_crkesriFieldTypeStringA transverse crack in the asphalt surface of a compsite pavement that is a result of the underlying joint formed by two abutting concrete slabs
JOINT_REF_CRK_VALUEjoint_ref_crk_valueesriFieldTypeSingleValue of the deduct associated with the Distress
JOINT_SLT_DMGjoint_slt_dmgesriFieldTypeStringA measure of the effectiveness of the material placed on the joint formed by two abutting concrete slabs to prevent water and other material from seeping between the slabs.
JOINT_SLT_DMG_VALUEjoint_slt_dmg_valueesriFieldTypeSingleValue of the deduct associated with the Distress
JOINT_EROSIONjoint_erosionesriFieldTypeStringA wearing away of the area and widening of the spacing between brick pavers. This additional spacing allows water and other materials to seep between the pavers.
JOINT_EROSION_VALUEjoint_erosion_valueesriFieldTypeSingleValue of the deduct associated with the Distress
JOINT_SPALLINGjoint_spallingesriFieldTypeStringThe break up or disintegration of the concrete at longitudinal or transverse pavement joints.
JOINT_SPALLING_VALUEjoint_spalling_valueesriFieldTypeSingleValue of the deduct associated with the Distress
LONGITUDINAL_JOINT_CRACKINGlongitudinal_joint_crackingesriFieldTypeStringCracks formed parallel to the centerline of the roadway, and are the result of paving joints, widening joints which have reflected up through the layers of overlay, or the result of gear box segregation.
LONG_JOINT_CRK_VALUElong_joint_crk_valueesriFieldTypeSingleValue of the deduct associated with the Distress
LONG_JOINT_SPALlong_joint_spalesriFieldTypeStringThe break up or disintegration of the concrete at longitudinal pavement joints.
LONG_JOINT_SPAL_VALUElong_joint_spal_valueesriFieldTypeSingleValue of the deduct associated with the Distress
LONGITUDINAL_CRACKINGlongitudinal_crackingesriFieldTypeStringA crack or break approximately parallel to the pavement centerline.
LONG_CRACKING_VALUElong_cracking_valueesriFieldTypeSingleValue of the deduct associated with the Distress
LOOSE_AGGREGATEloose_aggregateesriFieldTypeStringA movement of soil and other materials to form ridges in center of lanes of a gravel surface. The movement is usually caused by heavy dust action, erosion, etc.
LOOSE_AGGREGATE_VALUEloose_aggregate_valueesriFieldTypeSingleValue of the deduct associated with the Distress
MAP_CRACKINGmap_crackingesriFieldTypeStringInterconnected cracks that form a series of large polygon blocks which look, overall, like a map. The cracking appears to combine transverse and longitudinal cracks to form this map.
MAP_CRACKING_VALUEmap_cracking_valueesriFieldTypeSingleValue of the deduct associated with the Distress
INTER_TRANS_CRKinter_trans_crkesriFieldTypeStringA transverse crack in the asphalt surface of a compsite pavement that is a reflection of a mid-panel or mid-slab transverse crack in the underlying concrete slab
INTER_TRANS_CRK_VALUEinter_trans_crk_valueesriFieldTypeSingleValue of the deduct associated with the Distress
PATCHINGpatchingesriFieldTypeStringPatching is either the placing of asphalt concrete on the surface of the existing pavement
PATCHING_VALUEpatching_valueesriFieldTypeSingleValue of the deduct associated with the Distress
POPOUTpopoutesriFieldTypeStringCone shaped holes in the pavement surface with aggregates at the bottom and are unrelated to joint or crack spalling.
POPOUT_VALUEpopout_valueesriFieldTypeSingleValue of the deduct associated with the Distress
POTHOLEpotholeesriFieldTypeStringBowl-shaped voids or depressions in the pavement surface.
POTHOLE_VALUEpothole_valueesriFieldTypeSingleValue of the deduct associated with the Distress
PRESSURE_DAMAGEpressure_damageesriFieldTypeStringa bump or hump in the pavement surface at a transverse joint or crack. The upheaval is a result of thermal expansion in the underlying concrete base creating compressive forces.
PRESSURE_DAMAGE_VALUEpressure_damage_valueesriFieldTypeSingleValue of the deduct associated with the Distress
PUMPINGpumpingesriFieldTypeStringThe ejection of fine soil particles through pavement cracks, joints, or along pavement edges.
PUMPING_VALUEpumping_valueesriFieldTypeSingleValue of the deduct associated with the Distress
PUNCHOUTpunchoutesriFieldTypeStringA cracked rectangular area usually along the outside pavement edge. A punchout requires formation of longitudinal crack (usually within the outer wheel track) which connects transverse cracks of the composite pavement. The rectangular punchout area thus is defined by 2 transverse cracks, the longitudinal crack, and the outside pavement edge.
PUNCHOUT_VALUEpunchout_valueesriFieldTypeSingleValue of the deduct associated with the Distress
RANDOM_CRACKINGrandom_crackingesriFieldTypeStringCracks that do not clearly fit into one of the more-defined categories such as block and transvers, edge, longitudinal, transverse, edge, etc. For example, cracks which meander across or along the pavement would be classified as random cracks.
RANDOM_CRACKING_VALUErandom_cracking_valueesriFieldTypeSingleValue of the deduct associated with the Distress
RAVELINGravelingesriFieldTypeStringDisintegration of the pavement from the surface downward due to the loss of aggregate particles.
RAVELING_VALUEraveling_valueesriFieldTypeSingleValue of the deduct associated with the Distress
RUTTINGruttingesriFieldTypeStringVertical deformations in the pavement surface along the wheel tracks.
RUTTING_VALUErutting_valueesriFieldTypeSingleValue of the deduct associated with the Distress
SURF_DIS_OR_DEBONDsurf_dis_or_debondesriFieldTypeStringThe removal of the asphaltic surface layer from the underlying layer.
SURF_DIS_DEBOND_VALUEsurf_dis_debond_valueesriFieldTypeSingleValue of the deduct associated with the Distress
SETTLEMENTsettlementesriFieldTypeStringA dip in the longitudinal profile of the pavement surface.
SETTLEMENT_VALUEsettlement_valueesriFieldTypeSingleValue of the deduct associated with the Distress
SHATTERED_SLABshattered_slabesriFieldTypeStringThe breakup of the underlying rigid pavement made evident by surface reflection cracking and/or distortion.
SHATTERED_SLAB_VALUEshattered_slab_valueesriFieldTypeSingleValue of the deduct associated with the Distress
SPALLINGspallingesriFieldTypeStringThe cracking, breaking, chipping, or fraying of the concrete surface
SPALLING_VALUEspalling_valueesriFieldTypeSingleValue of the deduct associated with the Distress
SURFACE_DETERIORATIONsurface_deteriorationesriFieldTypeStringDisintegration or loss of concrete from the surface of the pavement. Includes scaling and abrasion.
SURFACE_DETER_VALUEsurface_deter_valueesriFieldTypeSingleValue of the deduct associated with the Distress
TRANSVERSE_CRKtransverse_crkesriFieldTypeStringA crack or break at approximately right angles to the pavement centerline.
TRANSVERSE_CRK_VALUEtransverse_crk_valueesriFieldTypeSingleValue of the deduct associated with the Distress
TRANS_CRK_PL_CONCtrans_crk_pl_concesriFieldTypeStringA crack or break at approximately right angles to the pavement centerline in plain concrete pavements.
TRANS_CRK_PL_CONC_VALUEtrans_crk_pl_conc_valueesriFieldTypeSingleValue of the deduct associated with the Distress
TRANS_CRK_RF_CONCtrans_crk_rf_concesriFieldTypeStringA crack or break at approximately right angles to the pavement centerline in reinforced concrete pavements.
TRANS_CRK_RF_CONC_VALUEtrans_crk_rf_conc_valueesriFieldTypeSingleValue of the deduct associated with the Distress
THERMAL_CRACKINGthermal_crackingesriFieldTypeStringA series of evenly spaced cracks that are oriented perpendicular to the centerline of the roadway. Thermal cracks should be present from edge of pavement to edge of pavement. Distress applies to flexible pavements.
THERMAL_CRACKING_VALUEthermal_cracking_valueesriFieldTypeSingleValue of the deduct associated with the Distress
TRANS_CRK_UJ_BASEtrans_crk_uj_baseesriFieldTypeStringA crack or break at approximately right angles to the pavement centerline in a composite pavement that has an unjointed base.
TRANS_CK_UJ_BASE_VALUEtrans_ck_uj_base_valueesriFieldTypeSingleValue of the deduct associated with the Distress
WASHBOARDwashboardesriFieldTypeStringA series of closely-spaced ridges or humps perpendicular to travel direction on a gravel pavement. Ridges are caused by traffic dislodging aggregate.
WASHBOARD_VALUEwashboard_valueesriFieldTypeSingleValue of the deduct associated with the Distress
WHEEL_TRACK_CRKwheel_track_crkesriFieldTypeStringCracks located within or near the wheel paths. For evaluation purposes, each wheel path shall be considered 3 feet (1 m) in width.
WHEEL_TRACK_CRK_VALUEwheel_track_crk_valueesriFieldTypeSingleValue of the deduct associated with the Distress
AADT_PASSENGERaadt_passengeresriFieldTypeIntegerMeasure of the Average Annual Daily Traffic passengers (Does not include trucks)
AADT_TOTALaadt_totalesriFieldTypeIntegerMeasure of the Average Annual Daily Traffic in total (Includes cars and trucks)
AADT_BC_TRUCKaadt_bc_truckesriFieldTypeIntegerAvearage Annual Truck Traffic (Includes all trucks single units and combination units)
ESALesalesriFieldTypeDoubleMeasure of total damage to road in speed zone. ESAL stands for Equivalend Single Axel Load which is a concept developed from data collected at the American Association of State Highway Officials (AASHO) Road Test to establish a damage relationship for com
AVG_IRIavg_iriesriFieldTypeIntegerInternational Roughness Index (IRI) average, aggregated per PCR section. IRI is measured as vertical inches traveled over a linear mile.
LEFT_MUNI_NAMEleft_muni_nameesriFieldTypeStringMunicipality located to the left of the roadway segment while traveling in the cardinal direction
CITY_NAMEcity_nameesriFieldTypeStringName of the City within Ohio
LEFT_TWP_NAMEleft_twp_nameesriFieldTypeStringTownship Name
TOWNSHIP_NAMEtownship_nameesriFieldTypeStringTownship located to the left of the roadway segment while traveling in the cardinal direction
(feature geometry)geomST_Multi(ST_SetSRID(ST_GeomFromGeoJSON(…), 4326))Feature geometry, WGS84
Geometry
  • SRID 4326 (WGS84). GIST index on geom.
  • Empty / null geometries stored as SQL NULL.

© 2026 State Planner