State Planner

Pennsylvania · November 4, 2026

New Housing Units Permitted 2020-2025

This is a real answer State Planner produced from Pennsylvania’s public data.

Ask this question, or one like it, in State Planner now. Sign up to try every feature free for 7 days, no card needed, and the question will be waiting in your new chat to change or send.

Ask this in State Planner →
  1. Pennsylvania County Building Permits: How Many New Homes Did Each County Permit, 2020-2025?


    New housing units permitted by Pennsylvania counties, 2020–2025

    Source: Census Bureau Building Permits Survey, final annual county estimates with the Bureau's imputation for permit offices that didn't report. These are new, privately owned housing units that permits authorized. A permit isn't a start or a completion, and the figures leave out manufactured homes, conversions and public housing. The per-resident rates use the Census Bureau's July 1, 2025 county population estimates.

    Statewide: permits authorized about 177,600 units over the six years. Of those, 100,800 (57%) were single-family houses, 9,300 were in 2–4 unit buildings and 67,500 were in buildings of 5 or more units.
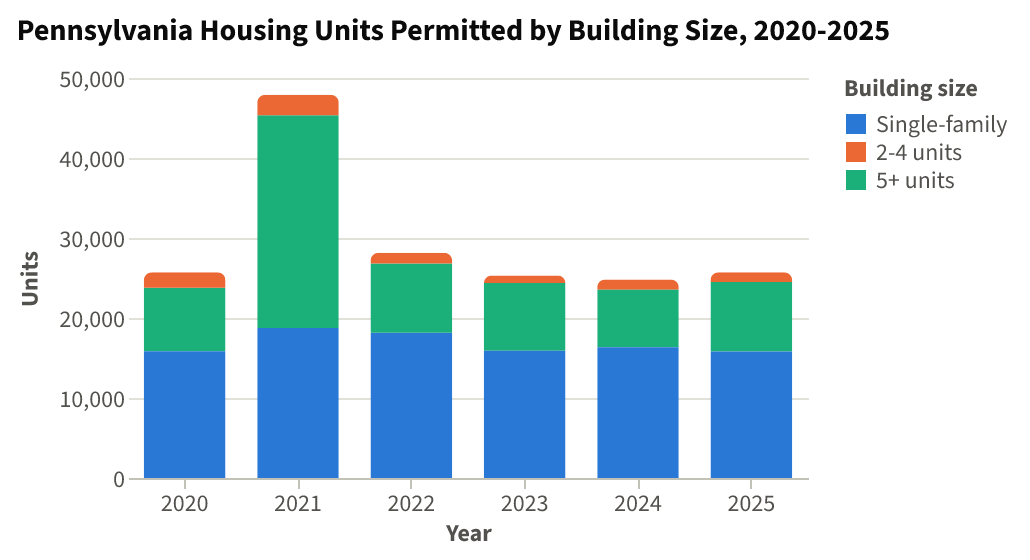
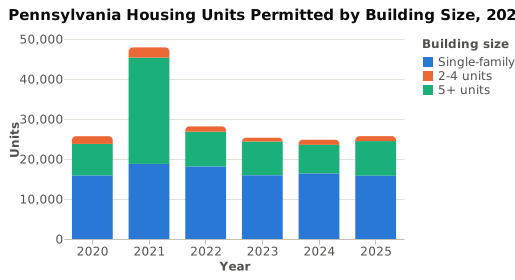
    Pennsylvania Housing Units Permitted by Building Size, 2020-2025⬇ CSV⬇ Image

    Most years came in at 25,000–28,000 units. 2021 was much higher, at 47,900, and nearly all of the extra units were in Philadelphia: the city permitted 25,257 units that year, 21,917 of them in buildings of 5 or more units. In every other year Philadelphia permitted about 3,000–5,700.
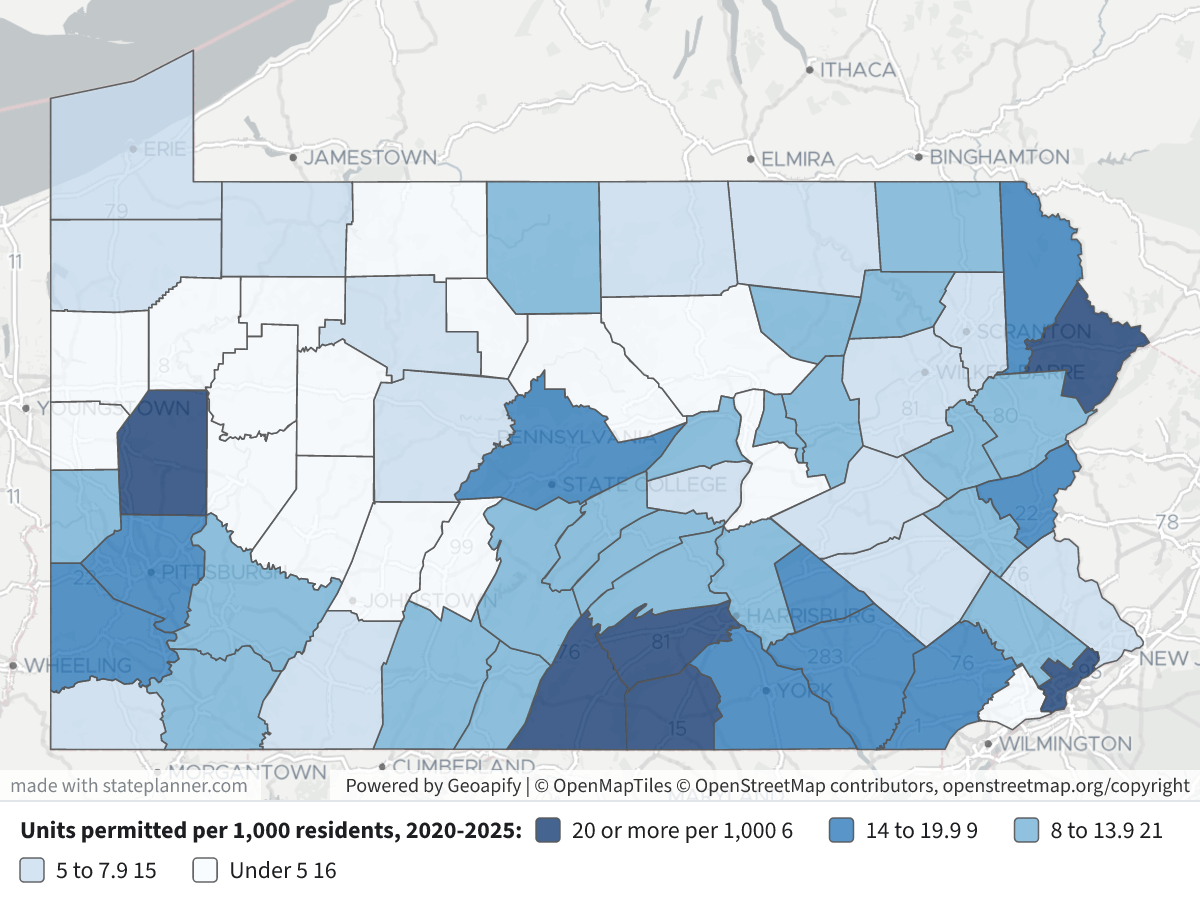
    New Housing Units Permitted 2020-2025New Housing Units Permitted 2020-2025⬇ Image

    Map legend: counties are shaded by units permitted per 1,000 residents over 2020–2025. Darkest navy is 20 or more, then mid-blue for 14–19.9, light blue for 8–13.9, pale blue for 5–7.9 and near-white for under 5. Click a county to see its total, its units by building size and its population.

    Housing units permitted by county, 2020–2025

    CountyTotal unitsSingle-family2–4 units5+ units2025 alonePer 1,000 residents
    Philadelphia44,3364,6145,06534,6573,36628.2
    Allegheny17,7867,8442159,7273,19114.5
    Montgomery11,6748,5352842,8552,23113.3
    Chester10,7667,9752222,5691,40019.3
    Lancaster8,1455,2793752,4911,29614.5
    York7,9735,9751921,8061,58916.8
    Butler6,6165,5252898021,24633.1
    Cumberland6,0854,3881561,54174521.9
    Northampton5,3982,9181652,3151,05016.6
    Bucks4,9123,960908627807.6
    Lehigh4,2203,149381,03339411.0
    Dauphin3,6862,4751981,01332912.6
    Franklin3,5152,6272356531,03321.9
    Washington3,1012,72624413135914.7
    Westmoreland2,8142,1303583264218.1
    Berks2,7251,9931226105826.2
    Centre2,7131,78717974731417.2
    Lebanon2,4301,6043878854216.6
    Adams2,2752,2750047621.1
    Luzerne1,9491,706771662955.9
    Delaware1,9131,584862432173.3
    Monroe1,5881,437131382579.5
    Erie1,462982424382435.5
    Lackawanna1,4611,1461881272776.7
    Beaver1,4091,011513472858.5
    Pike1,3701,003036716721.8
    Fayette1,2721,192562419610.3
    Schuylkill99187781062116.8
    Carbon922895101719514.0
    Wayne8848804015017.1
    Perry65063515012713.9
    Blair5964586870865.0
    Columbia5524755721118.3
    Mercer487447436904.5
    Clearfield4574102324755.9
    Crawford45345300995.5
    Mifflin44543645549.6
    Bradford425410411627.1
    Somerset42042000575.8
    Huntingdon413361448649.6
    Lycoming412363643693.7
    Bedford40740700758.6
    Cambria385375100613.0
    Susquehanna379362125619.9
    Lawrence36135326704.3
    Northumberland360340200314.0
    Union359307844638.5
    Snyder315299160697.9
    Armstrong289195292294.5
    Tioga26026000746.4
    Warren239165470356.5
    Wyoming234176850679.1
    Indiana224194300402.7
    Venango22321706504.5
    Juniata21521500309.2
    Greene20420400366.0
    Jefferson1961960004.5
    Elk18517780236.2
    McKean182170012334.7
    Clinton18017820384.8
    Montour15915180188.9
    Fulton149149001710.3
    Clarion14814800234.0
    Potter13513500218.5
    Sullivan7777001213.1
    Forest22220023.3
    Cameron000000.0

    Main points

    • By total units: Philadelphia (44,300) and Allegheny (17,800) permitted the most. Montgomery, Chester, Lancaster and York followed with about 8,000–11,700 each. Those six counties account for 57% of the statewide total.
    • Per resident: Butler permitted the most, with 33.1 units per 1,000 residents, mostly single-family. Philadelphia was next at 28.2, though about 57% of its units came in 2021 alone. Cumberland, Franklin, Pike, Adams and Chester also topped about 19 per 1,000.
    • Building size: in most counties outside the metro cores, nearly all permitted units were single-family houses. Philadelphia is the only county where most units were in buildings of 5 or more units (78%). Allegheny was just over half (55%).
    • Zero or near zero: Cameron County reported no permitted units over the six years, and Jefferson reported none in 2025.

    I can break down any county by permit office (municipality), show a year-by-year trend, or total the construction values (in nominal dollars) if you'd like.

Layers

  • …
    • …
    • …
    • …
    • …
    • …

Click anything on the map for its details.

The transcript below the answer shows every query it ran. Shapefiles of every layer, at full detail, can be downloaded in State Planner: sign up to ask your own question and export any map.

Ask your own question about Pennsylvania

Send takes you to sign up (every feature free for 7 days, no card needed), or to sign in if you have an account. Your question will be waiting in your new chat.

Transcript

What follows is the transcript of this chat as State Planner generated it. It is here to show how the answer above was arrived at: every query State Planner ran, what each one returned, and where the data came from.

transcript.md

↑ Contents

State Planner chat · https://stateplanner.com

  • State: Pennsylvania (PA)
  • Started: November 4, 2026, 3:56 AM UTC
  • Runtime: 54 sec
  • Status: completed
Prompt

Pennsylvania County Building Permits: How Many New Homes Did Each County Permit, 2020-2025?

Model: Anthropic: Claude Opus 5.5 (anthropic/claude-opus-5.5, via openrouter)

Response

New housing units permitted by Pennsylvania counties, 2020–2025

Source: Census Bureau Building Permits Survey, final annual county estimates with the Bureau's imputation for permit offices that didn't report. These are new, privately owned housing units that permits authorized. A permit isn't a start or a completion, and the figures leave out manufactured homes, conversions and public housing. The per-resident rates use the Census Bureau's July 1, 2025 county population estimates.

Statewide: permits authorized about 177,600 units over the six years. Of those, 100,800 (57%) were single-family houses, 9,300 were in 2–4 unit buildings and 67,500 were in buildings of 5 or more units.

Pennsylvania Housing Units Permitted by Building Size, 2020-2025

Most years came in at 25,000–28,000 units. 2021 was much higher, at 47,900, and nearly all of the extra units were in Philadelphia: the city permitted 25,257 units that year, 21,917 of them in buildings of 5 or more units. In every other year Philadelphia permitted about 3,000–5,700.

New Housing Units Permitted 2020-2025

Map legend: counties are shaded by units permitted per 1,000 residents over 2020–2025. Darkest navy is 20 or more, then mid-blue for 14–19.9, light blue for 8–13.9, pale blue for 5–7.9 and near-white for under 5. Click a county to see its total, its units by building size and its population.

Housing units permitted by county, 2020–2025

CountyTotal unitsSingle-family2–4 units5+ units2025 alonePer 1,000 residents
Philadelphia44,3364,6145,06534,6573,36628.2
Allegheny17,7867,8442159,7273,19114.5
Montgomery11,6748,5352842,8552,23113.3
Chester10,7667,9752222,5691,40019.3
Lancaster8,1455,2793752,4911,29614.5
York7,9735,9751921,8061,58916.8
Butler6,6165,5252898021,24633.1
Cumberland6,0854,3881561,54174521.9
Northampton5,3982,9181652,3151,05016.6
Bucks4,9123,960908627807.6
Lehigh4,2203,149381,03339411.0
Dauphin3,6862,4751981,01332912.6
Franklin3,5152,6272356531,03321.9
Washington3,1012,72624413135914.7
Westmoreland2,8142,1303583264218.1
Berks2,7251,9931226105826.2
Centre2,7131,78717974731417.2
Lebanon2,4301,6043878854216.6
Adams2,2752,2750047621.1
Luzerne1,9491,706771662955.9
Delaware1,9131,584862432173.3
Monroe1,5881,437131382579.5
Erie1,462982424382435.5
Lackawanna1,4611,1461881272776.7
Beaver1,4091,011513472858.5
Pike1,3701,003036716721.8
Fayette1,2721,192562419610.3
Schuylkill99187781062116.8
Carbon922895101719514.0
Wayne8848804015017.1
Perry65063515012713.9
Blair5964586870865.0
Columbia5524755721118.3
Mercer487447436904.5
Clearfield4574102324755.9
Crawford45345300995.5
Mifflin44543645549.6
Bradford425410411627.1
Somerset42042000575.8
Huntingdon413361448649.6
Lycoming412363643693.7
Bedford40740700758.6
Cambria385375100613.0
Susquehanna379362125619.9
Lawrence36135326704.3
Northumberland360340200314.0
Union359307844638.5
Snyder315299160697.9
Armstrong289195292294.5
Tioga26026000746.4
Warren239165470356.5
Wyoming234176850679.1
Indiana224194300402.7
Venango22321706504.5
Juniata21521500309.2
Greene20420400366.0
Jefferson1961960004.5
Elk18517780236.2
McKean182170012334.7
Clinton18017820384.8
Montour15915180188.9
Fulton149149001710.3
Clarion14814800234.0
Potter13513500218.5
Sullivan7777001213.1
Forest22220023.3
Cameron000000.0
Main points
  • By total units: Philadelphia (44,300) and Allegheny (17,800) permitted the most. Montgomery, Chester, Lancaster and York followed with about 8,000–11,700 each. Those six counties account for 57% of the statewide total.
  • Per resident: Butler permitted the most, with 33.1 units per 1,000 residents, mostly single-family. Philadelphia was next at 28.2, though about 57% of its units came in 2021 alone. Cumberland, Franklin, Pike, Adams and Chester also topped about 19 per 1,000.
  • Building size: in most counties outside the metro cores, nearly all permitted units were single-family houses. Philadelphia is the only county where most units were in buildings of 5 or more units (78%). Allegheny was just over half (55%).
  • Zero or near zero: Cameron County reported no permitted units over the six years, and Jefferson reported none in 2025.

I can break down any county by permit office (municipality), show a year-by-year trend, or total the construction values (in nominal dollars) if you'd like.

Chart Queries
Pennsylvania Housing Units Permitted by Building Size, 2020-2025
   SELECT YEAR AS "Year",
          s.size AS "Building size",
          sum(s.u) AS "Units"
     FROM pa_bps_county_permits,
          LATERAL (
             VALUES ('Single-family', units_1),
                    ('2-4 units', units_2 + units_3_4),
                    ('5+ units', units_5plus)
          ) s(size, u)
    WHERE YEAR BETWEEN 2020 AND 2025
 GROUP BY 1,
          2
 ORDER BY 1

charts/turn-1-pa-units-by-year.csv

Picture: charts/turn-1-pa-units-by-year.png

Exploratory Queries
Query 1 — Check years available and county coverage for 2020-2025.
   SELECT YEAR,
          count(*),
          sum(units_total) u,
          sum(units_1) sf,
          sum(units_5plus) mf5
     FROM pa_bps_county_permits
    WHERE YEAR >= 2019
 GROUP BY YEAR
 ORDER BY YEAR
yearcountusfmf5
20196723539148787097
20206725706158467921
202167478941876426590
20226728149181508658
20236725320159128457
20246724810163487192
20256725709158128675

data/turn-1-query-1.csv

Query 2 — Total permitted units by county 2020-2025 with per-1,000-resident rate.
     WITH p AS (
             SELECT geoid,
                    sum(units_total) u,
                    sum(units_1) sf,
                    sum(units_2 + units_3_4) small,
                    sum(units_5plus) mf,
                    sum(units_total) FILTER (
                        WHERE YEAR = 2025
                    ) u25
               FROM pa_bps_county_permits
              WHERE YEAR BETWEEN 2020 AND 2025
           GROUP BY geoid
          ),
          pop AS (
             SELECT geoid,
                    pop_estimate
               FROM pa_census_county_pop_est
              WHERE YEAR = (
                       SELECT max(YEAR)
                         FROM pa_census_county_pop_est
                    )
          )
   SELECT c.name,
          p.*,
          pop.pop_estimate,
          round(p.u * 1000.0 / pop.pop_estimate, 1) per1k
     FROM p
     JOIN pa_census_counties c USING (geoid)
LEFT JOIN pop USING (geoid)
 ORDER BY u DESC
namegeoidusfsmallmfu25pop_estimateper1k
Philadelphia County421014433646145065346573366157428128.2
Allegheny County4200317786784421597273191122503514.5
Montgomery County420911167485352842855223187764313.3
Chester County420291076679752222569140055711619.3
Lancaster County42071814552793752491129656315914.5
York County42133797359751921806158947319716.8
Butler County4201966165525289802124620016933.1
Cumberland County4204160854388156154174527727021.9
Northampton County42095539829181652315105032441116.6
Bucks County4201749123960908627806478287.6
Lehigh County420774220314938103339438438311.0
Dauphin County4204336862475198101332929335112.6
Franklin County4205535152627235653103316065221.9
Washington County421253101272624413135921080214.7
Westmoreland County42129281421303583264213493248.1
Berks County42011272519931226105824400726.2
Centre County420272713178717974731415739317.2
Lebanon County42075243016043878854214638016.6
Adams County42001227522750047610759421.1
Luzerne County4207919491706771662953321265.9
Delaware County4204519131584862432175809373.3
Monroe County4208915881437131382571671799.5
Erie County420491462982424382432658325.5
Lackawanna County42069146111461881272772165026.7
Beaver County4200714091011513472851660328.5

25 out of 67 are listed here.

data/turn-1-query-2.csv

Query 3 — Philadelphia's yearly totals and the population-estimate year used.
   SELECT YEAR,
          units_total,
          units_5plus,
          (
             SELECT max(YEAR)
               FROM pa_census_county_pop_est
          ) popyr
     FROM pa_bps_county_permits
    WHERE geoid = '42101'
      AND YEAR BETWEEN 2020 AND 2025
 ORDER BY YEAR
yearunits_totalunits_5pluspopyr
2020566536522025
202125257219172025
2022322320342025
2023386330272025
2024296218482025
2025336621792025

data/turn-1-query-3.csv

Map Layer Queries
Units permitted per 1,000 residents, 2020-2025 — colored by "cls": 20 or more per 1,000 (#08306b), 14 to 19.9 (#2171b5), 8 to 13.9 (#6baed6), 5 to 7.9 (#c6dbef), Under 5 (#f7fbff)
     WITH p AS (
             SELECT geoid,
                    sum(units_total) u,
                    sum(units_1) sf,
                    sum(units_2 + units_3_4) sm,
                    sum(units_5plus) mf
               FROM pa_bps_county_permits
              WHERE YEAR BETWEEN 2020 AND 2025
           GROUP BY geoid
          ),
          pop AS (
             SELECT geoid,
                    pop_estimate
               FROM pa_census_county_pop_est
              WHERE YEAR = 2025
          )
   SELECT c.geom,
          c.name AS "County",
          p.u AS "Units permitted 2020-2025",
          p.sf AS "Single-family units",
          p.sm AS "2-4 unit buildings",
          p.mf AS "5+ unit buildings",
          pop.pop_estimate AS "Population(2025 est.)",
          round(p.u * 1000.0 / pop.pop_estimate, 1) AS "Units per 1,000 residents",
          CASE
                    WHEN p.u * 1000.0 / pop.pop_estimate >= 20 THEN 'a'
                    WHEN p.u * 1000.0 / pop.pop_estimate >= 14 THEN 'b'
                    WHEN p.u * 1000.0 / pop.pop_estimate >= 8 THEN 'c'
                    WHEN p.u * 1000.0 / pop.pop_estimate >= 5 THEN 'd'
                    ELSE 'e'
          END AS cls
     FROM pa_census_counties c
     JOIN p USING (geoid)
     JOIN pop USING (geoid)

Picture: maps/turn-1-county-permits-2020-2025.png

Used Data Sets

data/turn-1-query-1.csv

↑ Contents
yearcountusfmf5
20196723539148787097
20206725706158467921
202167478941876426590
20226728149181508658
20236725320159128457
20246724810163487192
20256725709158128675

7 rows.

data/turn-1-query-2.csv

↑ Contents
namegeoidusfsmallmfu25pop_estimateper1k
Philadelphia County421014433646145065346573366157428128.2
Allegheny County4200317786784421597273191122503514.5
Montgomery County420911167485352842855223187764313.3
Chester County420291076679752222569140055711619.3
Lancaster County42071814552793752491129656315914.5
York County42133797359751921806158947319716.8
Butler County4201966165525289802124620016933.1
Cumberland County4204160854388156154174527727021.9
Northampton County42095539829181652315105032441116.6
Bucks County4201749123960908627806478287.6
Lehigh County420774220314938103339438438311.0
Dauphin County4204336862475198101332929335112.6
Franklin County4205535152627235653103316065221.9
Washington County421253101272624413135921080214.7
Westmoreland County42129281421303583264213493248.1
Berks County42011272519931226105824400726.2
Centre County420272713178717974731415739317.2
Lebanon County42075243016043878854214638016.6
Adams County42001227522750047610759421.1
Luzerne County4207919491706771662953321265.9
Delaware County4204519131584862432175809373.3
Monroe County4208915881437131382571671799.5
Erie County420491462982424382432658325.5
Lackawanna County42069146111461881272772165026.7
Beaver County4200714091011513472851660328.5
Pike County421031370100303671676280821.8
Fayette County4205112721192562419612302110.3
Schuylkill County4210799187781062111450856.8
Carbon County4202592289510171956586814.0
Wayne County42127884880401505170317.1
Perry County420996506351501274680613.9
Blair County420135964586870861195415.0
Columbia County42037552475572111661938.3
Mercer County42085487447436901078604.5
Clearfield County42033457410232475781005.9
Crawford County420394534530099817925.5
Mifflin County420874454364554461279.6
Bradford County4201542541041162596007.1
Somerset County421114204200057720045.8
Huntingdon County4206141336144864430019.6
Lycoming County42081412363643691125873.7
Bedford County420094074070075474808.6
Cambria County42021385375100611289683.0
Susquehanna County4211537936212561382379.9
Lawrence County420733613532670839114.3
Northumberland County4209736034020031899204.0
Union County4211935930784463423138.5
Snyder County4210931529916069396557.9
Armstrong County4200528919529229636984.5
Tioga County421172602600074405026.4
Warren County4212323916547035370386.5
Wyoming County4213123417685067257909.1
Indiana County4206322419430040828782.7
Venango County421212232170650493464.5
Juniata County420672152150030234039.2
Greene County420592042040036338856.0
Jefferson County42065196196000432554.5
Elk County420471851778023299266.2
McKean County4208318217001233389844.7
Clinton County420351801782038378704.8
Montour County420931591518018178688.9
Fulton County4205714914900171448310.3
Clarion County420311481480023366804.0
Potter County421051351350021158978.5
Sullivan County4211377770012585613.1
Forest County42053222200266143.3
Cameron County420230000042110.0

67 rows.

data/turn-1-query-3.csv

↑ Contents
yearunits_totalunits_5pluspopyr
2020566536522025
202125257219172025
2022322320342025
2023386330272025
2024296218482025
2025336621792025

6 rows.

charts/turn-1-pa-units-by-year.csv

↑ Contents
YearBuilding sizeUnits
20205+ units7921
20202-4 units1939
2020Single-family15846
2021Single-family18764
20215+ units26590
20212-4 units2540
2022Single-family18150
20225+ units8658
20222-4 units1341
20235+ units8457
2023Single-family15912
20232-4 units951
20242-4 units1270
20245+ units7192
2024Single-family16348
20255+ units8675
2025Single-family15812
20252-4 units1222

18 rows.

provenance/pa_bps_county_permits.md

↑ Contents

Provenance: pa_bps_county_permits

This file describes how the rows in PostgreSQL table pa_bps_county_permits were obtained from an external source: where they were fetched and how fields were renamed and typed. Field meanings are in the mapping table below.

Identity
  • Table: pa_bps_county_permits
  • Family: BPS
  • Display name: Building Permits by County
  • Source URL: https://www2.census.gov/econ/bps/County/ (co<year>a.txt, 1990 on)
  • Geometry (source / stored): none / none
  • Update cycle: Yearly (each May)
Pipeline

The Building Permits Survey publishes one national county file per year, the annual summary (a), comma-delimited text with a two-row header. Every year from 1990 is loaded; the newest year is the one before the current, once the Bureau has published it. Each year's file is downloaded whole and kept; the sync keeps Pennsylvania's rows (FIPS State 42) and checks each file's survey date names its year (2024, or 9099 in the 1990s files).

A county listed twice in one year (the 2014 and 2015 files repeat four Alaska boroughs and one Maryland county under a second name with the same estimates) keeps the row with more reported units; two rows with different estimates fail the sync. The monthly and year-to-date files are not loaded.

Changed from the source: cut to Pennsylvania; reshaped to one row per county per year; the three totals added; the region, division and survey-date columns dropped.

No licence terms: a work of the U.S. Government, credited to the U.S. Census Bureau.

Field → column mapping
Source fieldColumnTypeDescription
FIPS State, FIPS CountygeoidtextTwo digits and three, joined
County NamenametextTrailing spaces trimmed
Survey Dateyeartext → integerChecked against the file's year
1-unit Bldgs, Units, Valuebldgs_1, units_1, value_1integerEstimates with imputation
2-units Bldgs, Units, Valuebldgs_2, units_2, value_2integer
3-4 units Bldgs, Units, Valuebldgs_3_4, units_3_4, value_3_4integer
5+ units Bldgs, Units, Valuebldgs_5plus, units_5plus, value_5plusinteger
1-unit rep … 5+ units reprep_bldgs_1 … rep_value_5plusintegerReported only
(computed)bldgs_total, units_total, value_totalThe four estimate sizes added
Region Code, Division Code(dropped)

provenance/pa_census_counties.md

↑ Contents

Provenance: pa_census_counties

This file describes how the rows in PostgreSQL table pa_census_counties were obtained from an external source: where they were fetched and how fields were renamed and typed. Field meanings are in the mapping table below.

Identity
Pipeline

Two Census Bureau sources, joined on the county's 5-digit FIPS code:

  • Boundaries: TIGERweb tigerWMS_Current layer 82 ("Counties"), where=STATE='42', GeoJSON, outSR=4326, keyset-paged on GEOID.
  • CFS areas: sheet CFSAreas of the 2022 Commodity Flow Survey county list, the Pennsylvania rows (ST = 42). Only the 2022 columns are kept.

The two must name the same counties, or the sync fails. FAF's pa_faf_county_xwalk is built from this table: each county's cfs_geoid is the CFS22_ID of one FAF6 zone.

Field → column mapping
Source fieldColumnTypeDescription
TIGER GEOIDgeoidvarchar(5)state + county FIPS
TIGER GEOID, last 3county_fipsvarchar(3)county FIPS
TIGER NAMEnamevarchar(60)e.g. Philadelphia County
CFS CFS22_AREAcfs_areavarchar(5)CSA/MSA code, or 99999
CFS CFS22_TYPEcfs_area_typevarchar(1)C, M or R
CFS CFS22_NAME, whitespace collapsedcfs_area_namevarchar(120)the workbook pads some names with doubled and trailing spaces
CFS CFS22_GEOIDcfs_geoidvarchar(19)e.g. E330000US4242800000
TIGER AREALANDaland_m2bigintsquare meters
TIGER AREAWATERawater_m2bigintsquare meters
TIGER INTPTLATintptlatdouble precisioninternal point
TIGER INTPTLONintptlondouble precisioninternal point
geometrygeomgeometry(MultiPolygon, 4326)ST_Multi(ST_GeomFromGeoJSON)
Geometry
  • SRID 4326 (WGS84). GIST index on geom.
Change detection

The Census sync's check compares the layer's vintage ("January 1, 2026 vintage") and Pennsylvania's row count, and the county list's Last-Modified and length. A change to either marks Census stale, and the next Census sync rebuilds this table, then FAF's crosswalk.

Attribution

US Census Bureau. TIGER products are free to use with acknowledgement of the U.S. Census Bureau as the source; the CFS county list states no terms.

provenance/pa_census_county_pop_est.md

↑ Contents

Provenance: pa_census_county_pop_est

This file describes how the rows in PostgreSQL table pa_census_county_pop_est were obtained from an external source: where they were fetched and how fields were renamed and typed. Field meanings are in the mapping table below.

Identity
  • Table: pa_census_county_pop_est
  • Family: Census
  • Display name: Annual Population Estimates by County
  • Source URL: https://www2.census.gov/programs-surveys/popest/datasets/2020-2025/counties/totals/co-est2025-alldata.csv (vintage 2025; each vintage <V> is 2020-<V>/counties/totals/co-est<V>-alldata.csv), for 2020 on
  • History (2000–2019): under the same datasets/ directory, 2000-2010/intercensal/county/co-est00int-tot.csv and 2010-2020/intercensal/county/asrh/cc-est2020int-agesex-all.csv (the revised population), 2010/2010-eval-estimates/co-est2010-alldata.csv and 2010-2020/counties/totals/co-est2020-alldata.csv (the components of change of the releases they revised)
  • History (1970–1999): under https://www2.census.gov/programs-surveys/popest/tables/, 1900-1980/counties/asrh/co-asr-7079.csv, 1980-1990/counties/asrh/pe-02-<year>.csv and 1990-2000/intercensal/st-co/stch-icen<year>.txt (the county age, sex and race estimates), and 1900-1980/counties/totals/e7079co.txt and 1980-1990/counties/totals/e8089co.txt (the decades' county totals tables, for their census counts)
  • Geometry (source / stored): none / none
  • Update cycle: Yearly (each March)
Pipeline

The Population Estimates Program's national county file, CSV, one row per county with a column per year for each figure. The sync keeps Pennsylvania's county rows (SUMLEV 050, STATE 42), dropping the state's own total (040), and turns each into one row per year, the years read off the file's POPESTIMATE<year> columns. Every county the file names must be one the county layer of TIGERweb draws, or the sync fails. A file that is not valid UTF-8 is read as Latin-1. These rows are series postcensal.

The years before 2020 are series intercensal, from four further national files that never change:

  • Population, 2000–2009: co-est00int-tot.csv, one row per county, codes written without leading zeros (SUMLEV "50", STATE "1"), which the sync pads. ESTIMATESBASE2000 and POPESTIMATE2000–2009; its POPESTIMATE2010 and CENSUS2010POP are not loaded. vintage 2010.
  • Population, 2010–2019: the Bureau's table of revised county totals for the decade is a spreadsheet that names counties without codes, so the sync reads the same figures from cc-est2020int-agesex-all.csv, one row per county and YEAR code, its POPESTIMATE the whole population: YEAR 1 is the April 1, 2010 base, 2–11 July 1, 2010–2019, and 12 (the April 1, 2020 census) is not loaded. vintage 2020. 2010 is taken from this file, not the 2000s one, which has its own figure for it.
  • Components: the original releases' files, as published, matched by county code: co-est2010-alldata.csv for 2000–2010 (2000 is April to June) and co-est2020-alldata.csv for 2011–2019. Their natural change column is NATURALINC<year>. A county with no row in the 2000s release (one coded anew in the 2010s) has empty 2010 components; any other missing county fails the sync.
  • pop_change is computed, not read: pop_estimate less the row before's (2010's less the 2000s file's 2009, 2000's less 1999's, or ESTIMATESBASE2000 for a county with no 1999 row). The releases' NPOPCHG_<year> describes their own population, not the revised one, and is not loaded.
  • 1970–1999: each county's July 1 population is the sum of its age, sex and race estimates, which pa_census_county_pop_char loads from the same files (its provenance has their layouts): vintage 1980, 1990 and 2000 for the three decades. The Bureau's county totals tables for the 1970s and 1980s, e7079co.txt and e8089co.txt, are fixed-width text in blocks of five years, a long name wrapping onto a line of its own; only their first column, the decade's April 1 census, is loaded, into estimates_base on the 1970 and 1980 rows. Their July figures are not loaded: the 1970s table rounds counties to hundreds, and both are on the geography of their day as the age files are, but not always the same day's. No component of change is loaded before 2000. pop_change is computed as for the later decades, 1970's from the April 1970 count, and the 2000 row's is from July 1999.
  • A history row's county need not be one TIGER draws today (Connecticut's eight old counties, the 1970s' Alaskan census divisions and Virginia's Nansemond, and a handful elsewhere); the sync logs them.
Field → column mapping
Source fieldColumnTypeDescription
STATE + COUNTYgeoidvarchar(5)county FIPS
the <year> suffixyearsmallint
the newest <year>vintagesmallint1980, 1990, 2000, 2010 or 2020 on history rows
seriesvarchar(12)postcensal, or intercensal on history rows
POPESTIMATE<year>pop_estimateinteger
ESTIMATESBASE2020estimates_baseinteger2020 row only (ESTIMATESBASE2000, YEAR 1 on the 2000 and 2010 rows; the decade tables' census column on the 1970 and 1980 rows)
NPOPCHG<year>pop_changeintegercomputed on history rows
BIRTHS<year>birthsinteger
DEATHS<year>deathsinteger
NATURALCHG<year>natural_changeintegerNATURALINC<year> on history rows
INTERNATIONALMIG<year>international_miginteger
DOMESTICMIG<year>domestic_miginteger
NETMIG<year>net_miginteger
RESIDUAL<year>residualinteger
GQESTIMATES<year>gq_estimateinteger

The file's per-1,000 rate columns (R…) and GQESTIMATESBASE2020 are not loaded.

Geometry
  • No geometry column.
Change detection

The Census sync's check asks for the next vintage's file each time and moves to it once it is published; otherwise it compares the current file's Last-Modified and length, and each history file's. Any of them marks this table stale, and the next Census sync rebuilds it whole, every year from 2020 replaced by the new release.

Attribution

US Census Bureau, Population Estimates Program.

© 2026 State Planner