transcript.md
↑ ContentsState Planner chat · https://stateplanner.com
- State: South Carolina (SC)
- Started: November 2, 2026, 4:43 PM UTC
- Runtime: 45 sec
- Status: completed
Prompt
South Carolina Building Permit Data: How Many Building Permits Were Issued by County, 2020-2025?
Model: Anthropic: Claude Opus 5.5 (anthropic/claude-opus-5.5, via openrouter)
Response
Housing units authorized by building permits in South Carolina, 2020–2025
These figures come from the Census Bureau's Building Permits Survey, using its estimates, which fill in for permit offices that didn't report. The survey doesn't count permits themselves. It counts the new privately owned housing units (and the buildings they're in) that permits authorized. A permit authorizes construction. It isn't a start or a completion, and some permitted units are never built. The survey leaves out manufactured homes, renovations and public housing.
Statewide total: about 274,500 housing units in roughly 238,700 buildings were authorized from 2020 through 2025. About 86% were single-family homes.
| Year | Units | Single-family | 5+ unit buildings | Buildings |
|---|---|---|---|---|
| 2020 | 42,340 | 36,226 | 5,718 | 36,657 |
| 2021 | 50,680 | 43,264 | 6,958 | 43,756 |
| 2022 | 46,038 | 37,906 | 7,317 | 38,571 |
| 2023 | 42,474 | 37,163 | 4,086 | 37,988 |
| 2024 | 47,072 | 40,558 | 5,503 | 41,287 |
| 2025 | 45,862 | 39,897 | 5,181 | 40,460 |
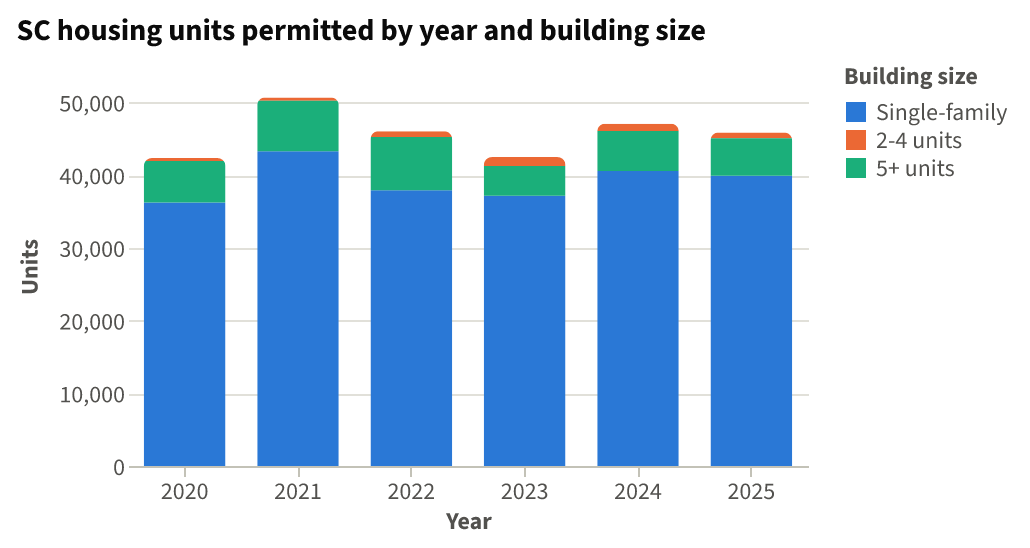
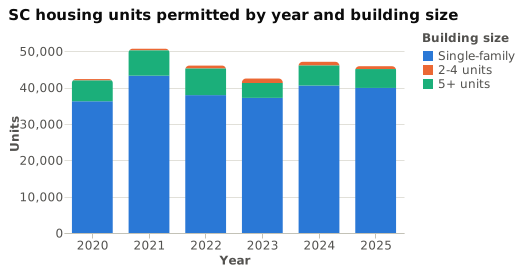
The chart stacks each year's units by building size. Single-family homes make up most of every year. The peak was 2021, at 50,700 units. Units in buildings of five or more peaked in 2022 (7,300) and fell to about 4,100 in 2023.
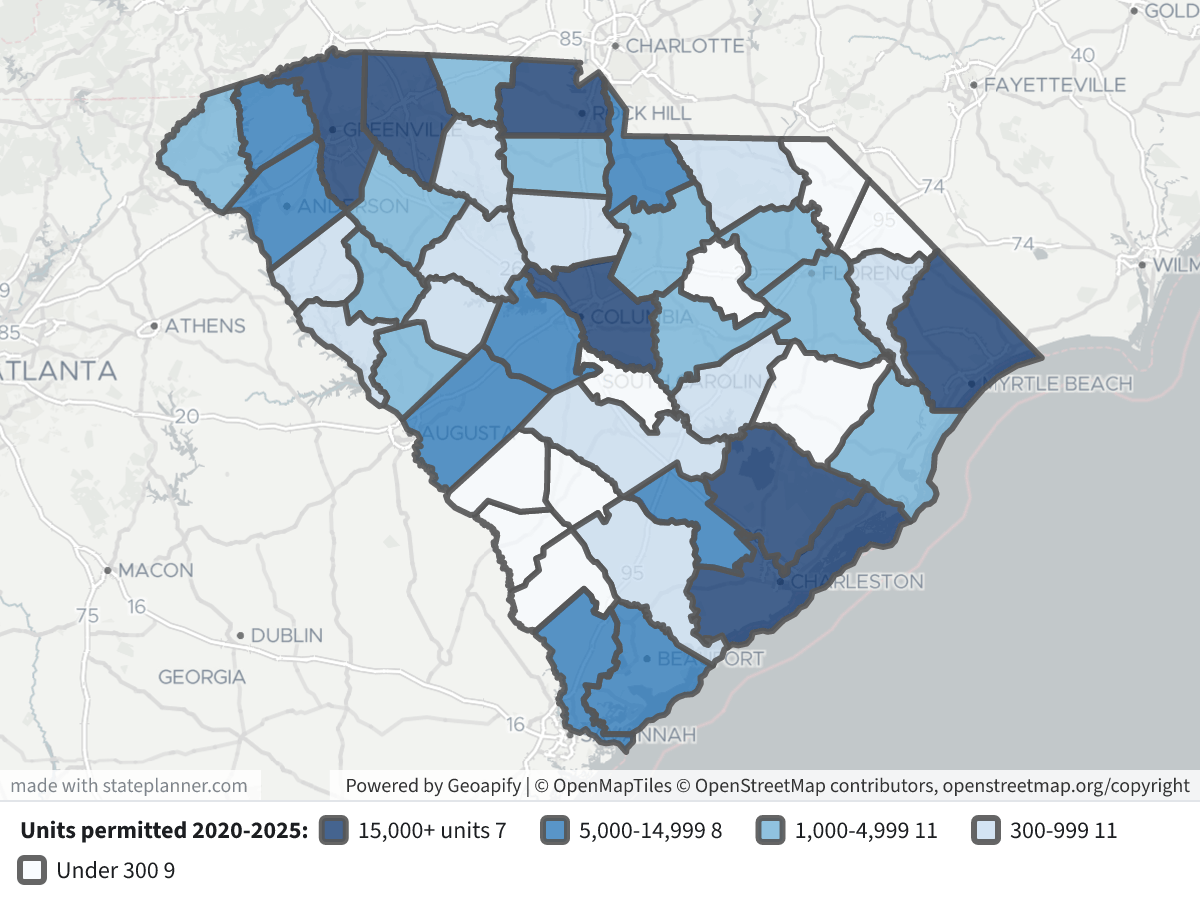
Map legend: each county is shaded by its total units permitted from 2020 to 2025: darkest navy for 15,000 or more, then 5,000–14,999, 1,000–4,999 and 300–999, and nearly white for under 300. Click a county to see its single-family and multi-unit split and its 2025 figure.
Housing units permitted by county, 2020–2025
| County | 2020 | 2021 | 2022 | 2023 | 2024 | 2025 | Total | Single-family | 2+ unit bldgs |
|---|---|---|---|---|---|---|---|---|---|
| Horry | 5,419 | 6,970 | 7,071 | 6,513 | 7,331 | 6,511 | 39,815 | 38,718 | 1,097 |
| Greenville | 6,122 | 7,964 | 4,738 | 4,774 | 5,575 | 4,947 | 34,120 | 28,656 | 5,464 |
| Charleston | 4,273 | 3,863 | 4,553 | 4,558 | 4,153 | 3,392 | 24,792 | 16,591 | 8,201 |
| Spartanburg | 2,876 | 3,614 | 2,596 | 2,867 | 3,129 | 3,986 | 19,068 | 18,765 | 303 |
| Richland | 1,781 | 3,263 | 3,439 | 2,843 | 3,469 | 3,382 | 18,177 | 12,839 | 5,338 |
| Berkeley | 2,967 | 3,121 | 3,236 | 2,904 | 3,169 | 2,299 | 17,696 | 12,422 | 5,274 |
| York | 2,555 | 3,271 | 2,720 | 2,289 | 2,513 | 2,646 | 15,994 | 13,445 | 2,549 |
| Lexington | 2,396 | 2,692 | 1,816 | 1,815 | 1,758 | 2,006 | 12,483 | 11,956 | 527 |
| Beaufort | 2,287 | 2,827 | 1,904 | 1,634 | 1,638 | 1,219 | 11,509 | 9,259 | 2,250 |
| Aiken | 1,145 | 1,644 | 1,719 | 1,472 | 2,500 | 1,959 | 10,439 | 8,643 | 1,796 |
| Anderson | 1,569 | 1,425 | 1,531 | 1,401 | 1,255 | 1,493 | 8,674 | 7,158 | 1,516 |
| Dorchester | 1,364 | 1,298 | 1,702 | 1,111 | 1,192 | 1,596 | 8,263 | 7,820 | 443 |
| Jasper | 690 | 871 | 1,047 | 1,320 | 1,408 | 1,858 | 7,194 | 6,494 | 700 |
| Pickens | 857 | 1,030 | 1,658 | 1,087 | 1,424 | 946 | 7,002 | 5,367 | 1,635 |
| Lancaster | 1,458 | 1,445 | 1,072 | 699 | 997 | 1,110 | 6,781 | 6,731 | 50 |
| Oconee | 424 | 643 | 833 | 612 | 648 | 753 | 3,913 | 3,853 | 60 |
| Florence | 630 | 623 | 626 | 536 | 666 | 697 | 3,778 | 3,267 | 511 |
| Kershaw | 494 | 753 | 413 | 661 | 474 | 509 | 3,304 | 2,998 | 306 |
| Georgetown | 622 | 665 | 469 | 355 | 327 | 377 | 2,815 | 2,419 | 396 |
| Laurens | 186 | 185 | 317 | 422 | 621 | 869 | 2,600 | 2,531 | 69 |
| Sumter | 333 | 388 | 402 | 381 | 386 | 358 | 2,248 | 1,998 | 250 |
| Cherokee | 174 | 173 | 186 | 270 | 239 | 286 | 1,328 | 1,203 | 125 |
| Edgefield | 219 | 194 | 237 | 238 | 181 | 194 | 1,263 | 1,240 | 23 |
| Greenwood | 136 | 282 | 261 | 62 | 193 | 310 | 1,244 | 1,215 | 29 |
| Chester | 82 | 78 | 114 | 164 | 269 | 310 | 1,017 | 1,017 | 0 |
| Darlington | 134 | 143 | 133 | 201 | 195 | 205 | 1,011 | 910 | 101 |
| Newberry | 142 | 152 | 193 | 180 | 155 | 160 | 982 | 973 | 9 |
| Abbeville | 108 | 148 | 121 | 157 | 145 | 157 | 836 | 776 | 60 |
| Chesterfield | 146 | 134 | 105 | 170 | 147 | 117 | 819 | 797 | 22 |
| McCormick | 117 | 165 | 151 | 115 | 141 | 119 | 808 | 808 | 0 |
| Union | 31 | 42 | 48 | 56 | 101 | 373 | 651 | 367 | 284 |
| Clarendon | 75 | 84 | 100 | 92 | 114 | 114 | 579 | 577 | 2 |
| Orangeburg | 74 | 90 | 90 | 83 | 101 | 107 | 545 | 511 | 34 |
| Saluda | 121 | 118 | 63 | 47 | 52 | 61 | 462 | 462 | 0 |
| Marion | 81 | 70 | 77 | 73 | 76 | 71 | 448 | 448 | 0 |
| Fairfield | 72 | 55 | 66 | 76 | 91 | 74 | 434 | 434 | 0 |
| Colleton | 40 | 73 | 71 | 66 | 48 | 73 | 371 | 359 | 12 |
| Dillon | 34 | 42 | 44 | 42 | 41 | 41 | 244 | 244 | 0 |
| Williamsburg | 33 | 39 | 38 | 37 | 34 | 35 | 216 | 216 | 0 |
| Calhoun | 8 | 0 | 7 | 23 | 48 | 38 | 124 | 124 | 0 |
| Barnwell | 17 | 4 | 31 | 21 | 17 | 31 | 121 | 117 | 4 |
| Lee | 11 | 8 | 17 | 17 | 18 | 22 | 93 | 93 | 0 |
| Hampton | 20 | 11 | 8 | 10 | 10 | 17 | 76 | 76 | 0 |
| Bamberg | 15 | 6 | 6 | 9 | 11 | 24 | 71 | 59 | 12 |
| Marlboro | 0 | 12 | 7 | 7 | 6 | 6 | 38 | 38 | 0 |
| Allendale | 2 | 2 | 2 | 4 | 6 | 4 | 20 | 20 | 0 |
What stands out
- Horry County had the most units permitted every year except 2020 and 2021, when Greenville led. Its six-year total was about 39,800, and 97% of them were single-family.
- Greenville, Charleston, Spartanburg, Richland, Berkeley and York follow. Together with Horry, these seven counties account for about 69% of all units in the state.
- Charleston had the most units in buildings of two or more (8,200). Richland, Berkeley and Greenville each had more than 5,000.
- Jasper, Laurens, Chester and Union permitted steadily more units each year, and in 2025 each was at two to twelve times its 2020 level. In Union, 2025 alone accounts for 373 of its 651 units.
These are the Bureau's final annual figures, and 2025 is the latest year loaded. I can also show permits per 1,000 residents, construction value (in nominal dollars), or the figures for individual city and town permit offices.
Chart Queries
SC housing units permitted by year and building size
   SELECT YEAR::text AS "Year",
          t.k AS "Building size",
          t.v AS "Units"
     FROM (
             SELECT YEAR,
                    sum(units_1) a,
                    sum(units_2 + units_3_4) b,
                    sum(units_5plus) c
               FROM sc_bps_county_permits
              WHERE YEAR BETWEEN 2020 AND 2025
           GROUP BY YEAR
          ) s
    CROSS JOIN LATERAL (
             VALUES ('Single-family', a),
                    ('2-4 units', b),
                    ('5+ units', c)
          ) t(k, v)
 ORDER BY YEAR
charts/turn-1-statewide-by-year.csv
Picture: charts/turn-1-statewide-by-year.png
Exploratory Queries
Query 1 — Check years available and statewide totals 2020 onward.
   SELECT YEAR,
          count(*) n,
          sum(units_total) units,
          sum(units_1) sf,
          sum(units_5plus) mf5,
          sum(bldgs_total) bldgs
     FROM sc_bps_county_permits
    WHERE YEAR >= 2020
 GROUP BY YEAR
 ORDER BY YEAR
| year | n | units | sf | mf5 | bldgs |
|---|---|---|---|---|---|
| 2020 | 46 | 42340 | 36226 | 5718 | 36657 |
| 2021 | 46 | 50680 | 43264 | 6958 | 43756 |
| 2022 | 46 | 46038 | 37906 | 7317 | 38571 |
| 2023 | 46 | 42474 | 37163 | 4086 | 37988 |
| 2024 | 46 | 47072 | 40558 | 5503 | 41287 |
| 2025 | 46 | 45862 | 39897 | 5181 | 40460 |
Query 2 — Housing units permitted by county and year, 2020-2025.
   SELECT c.name county,
          sum(units_total) FILTER (
              WHERE YEAR = 2020
          ) y2020,
          sum(units_total) FILTER (
              WHERE YEAR = 2021
          ) y2021,
          sum(units_total) FILTER (
              WHERE YEAR = 2022
          ) y2022,
          sum(units_total) FILTER (
              WHERE YEAR = 2023
          ) y2023,
          sum(units_total) FILTER (
              WHERE YEAR = 2024
          ) y2024,
          sum(units_total) FILTER (
              WHERE YEAR = 2025
          ) y2025,
          sum(units_total) total,
          sum(units_1) sf,
          sum(units_2 + units_3_4 + units_5plus) mf
     FROM sc_bps_county_permits p
     JOIN sc_census_counties c ON c.geoid = p.geoid
    WHERE YEAR BETWEEN 2020 AND 2025
 GROUP BY c.name
 ORDER BY total DESC
| county | y2020 | y2021 | y2022 | y2023 | y2024 | y2025 | total | sf | mf |
|---|---|---|---|---|---|---|---|---|---|
| Horry County | 5419 | 6970 | 7071 | 6513 | 7331 | 6511 | 39815 | 38718 | 1097 |
| Greenville County | 6122 | 7964 | 4738 | 4774 | 5575 | 4947 | 34120 | 28656 | 5464 |
| Charleston County | 4273 | 3863 | 4553 | 4558 | 4153 | 3392 | 24792 | 16591 | 8201 |
| Spartanburg County | 2876 | 3614 | 2596 | 2867 | 3129 | 3986 | 19068 | 18765 | 303 |
| Richland County | 1781 | 3263 | 3439 | 2843 | 3469 | 3382 | 18177 | 12839 | 5338 |
| Berkeley County | 2967 | 3121 | 3236 | 2904 | 3169 | 2299 | 17696 | 12422 | 5274 |
| York County | 2555 | 3271 | 2720 | 2289 | 2513 | 2646 | 15994 | 13445 | 2549 |
| Lexington County | 2396 | 2692 | 1816 | 1815 | 1758 | 2006 | 12483 | 11956 | 527 |
| Beaufort County | 2287 | 2827 | 1904 | 1634 | 1638 | 1219 | 11509 | 9259 | 2250 |
| Aiken County | 1145 | 1644 | 1719 | 1472 | 2500 | 1959 | 10439 | 8643 | 1796 |
| Anderson County | 1569 | 1425 | 1531 | 1401 | 1255 | 1493 | 8674 | 7158 | 1516 |
| Dorchester County | 1364 | 1298 | 1702 | 1111 | 1192 | 1596 | 8263 | 7820 | 443 |
| Jasper County | 690 | 871 | 1047 | 1320 | 1408 | 1858 | 7194 | 6494 | 700 |
| Pickens County | 857 | 1030 | 1658 | 1087 | 1424 | 946 | 7002 | 5367 | 1635 |
| Lancaster County | 1458 | 1445 | 1072 | 699 | 997 | 1110 | 6781 | 6731 | 50 |
| Oconee County | 424 | 643 | 833 | 612 | 648 | 753 | 3913 | 3853 | 60 |
| Florence County | 630 | 623 | 626 | 536 | 666 | 697 | 3778 | 3267 | 511 |
| Kershaw County | 494 | 753 | 413 | 661 | 474 | 509 | 3304 | 2998 | 306 |
| Georgetown County | 622 | 665 | 469 | 355 | 327 | 377 | 2815 | 2419 | 396 |
| Laurens County | 186 | 185 | 317 | 422 | 621 | 869 | 2600 | 2531 | 69 |
| Sumter County | 333 | 388 | 402 | 381 | 386 | 358 | 2248 | 1998 | 250 |
| Cherokee County | 174 | 173 | 186 | 270 | 239 | 286 | 1328 | 1203 | 125 |
| Edgefield County | 219 | 194 | 237 | 238 | 181 | 194 | 1263 | 1240 | 23 |
| Greenwood County | 136 | 282 | 261 | 62 | 193 | 310 | 1244 | 1215 | 29 |
| Chester County | 82 | 78 | 114 | 164 | 269 | 310 | 1017 | 1017 | 0 |
25 out of 46 are listed here.
Map Layer Queries
Units permitted 2020-2025 — colored by "cls": 15,000+ units (#08306b), 5,000-14,999 (#2171b5), 1,000-4,999 (#6baed6), 300-999 (#c6dbef), Under 300 (#f7fbff)
   SELECT c.geom,
          c.name AS "County",
          s.total AS "Units permitted 2020-2025",
          s.sf AS "Single-family units",
          s.mf AS "Units in 2+ unit buildings",
          s.y2025 AS "Units 2025",
          CASE
                    WHEN s.total >= 15000 THEN 'a'
                    WHEN s.total >= 5000 THEN 'b'
                    WHEN s.total >= 1000 THEN 'c'
                    WHEN s.total >= 300 THEN 'd'
                    ELSE 'e'
          END AS cls
     FROM sc_census_counties c
     JOIN (
             SELECT geoid,
                    sum(units_total) total,
                    sum(units_1) sf,
                    sum(units_2 + units_3_4 + units_5plus) mf,
                    sum(units_total) FILTER (
                        WHERE YEAR = 2025
                    ) y2025
               FROM sc_bps_county_permits
              WHERE YEAR BETWEEN 2020 AND 2025
           GROUP BY geoid
          ) s ON s.geoid = c.geoid
Picture: maps/turn-1-permits-by-county.png
Used Data Sets
sc_bps_county_permits— last synced 2026-10-14 · 1,656 rowssc_census_counties— last synced 2026-09-27 · 46 rows