transcript.md
↑ ContentsState Planner chat · https://stateplanner.com
- State: South Dakota (SD)
- Started: November 9, 2026, 6:08 PM UTC
- Runtime: 38 sec
- Status: completed
Prompt
Which South Dakota counties permitted the most new homes from 2020 to 2025, in total and per 1,000 residents?
Model: Anthropic: Claude Opus 5.5 (anthropic/claude-opus-5.5, via openrouter)
Response
New homes permitted by South Dakota counties, 2020–2025
Building permits allowed 42,392 new privately owned housing units across South Dakota from 2020 through 2025. That works out to about 45 units for every 1,000 residents. The figures are the Census Bureau's Building Permits Survey estimates, imputation included. The rate divides each county's six-year total by its July 1, 2025 population estimate.
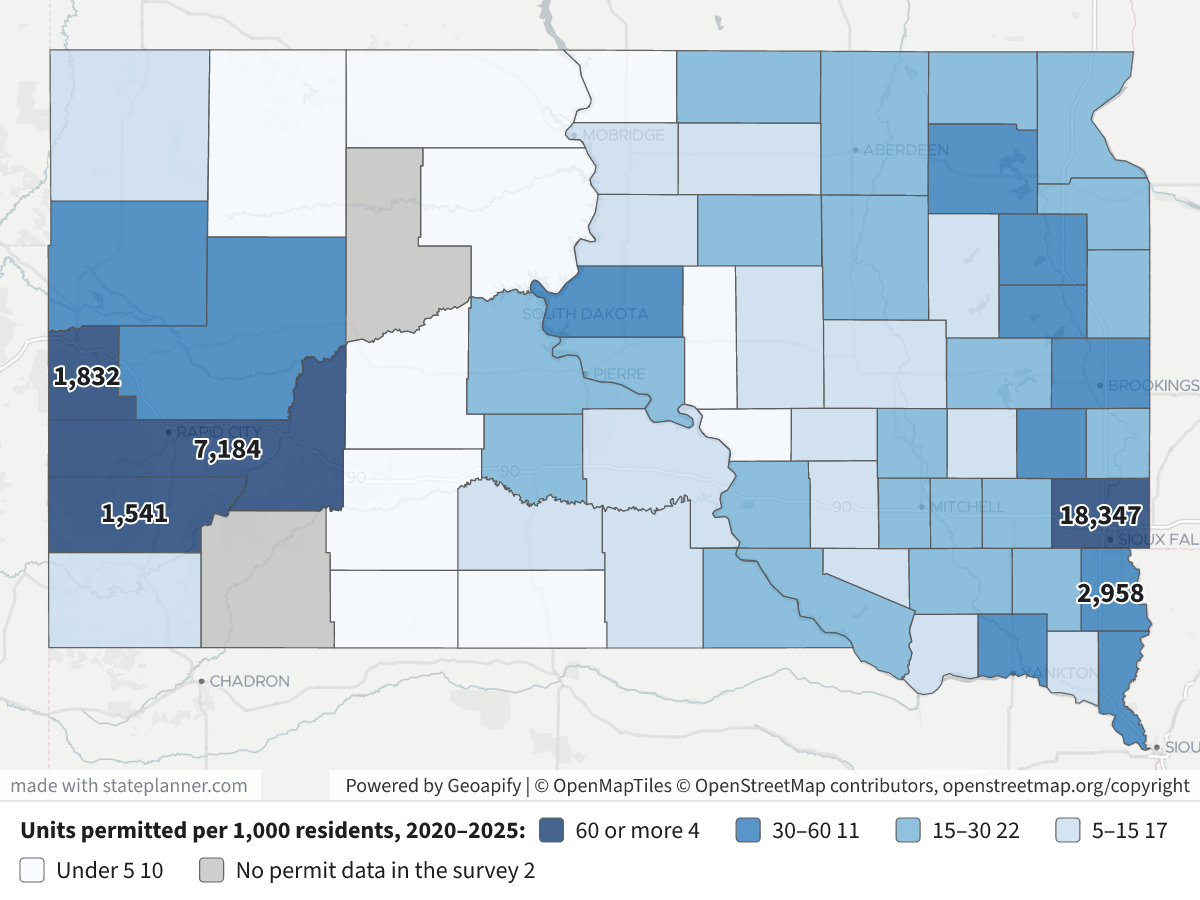
Map legend: counties are shaded by units permitted per 1,000 residents. Dark navy means 60 or more, blue 30–60, light blue 15–30, pale blue 5–15 and near-white under 5. Grey means the county has no rows in the survey. The numbers on the map are six-year unit totals for the top five counties by total. Click a county to see its totals, single-family and 5+ unit counts, and population.
Top 10 counties by total units permitted, 2020–2025
| County | Units | Single-family | In 5+ unit buildings | Per 1,000 residents |
|---|---|---|---|---|
| Minnehaha | 18,347 | 6,890 | 11,064 | 86.3 |
| Pennington | 7,184 | 2,708 | 4,250 | 61.5 |
| Lincoln | 2,958 | 1,619 | 822 | 38.3 |
| Lawrence | 1,832 | 1,399 | 321 | 62.2 |
| Custer | 1,541 | 1,531 | 0 | 163.4 |
| Brookings | 1,140 | 735 | 260 | 30.3 |
| Union | 1,043 | 663 | 257 | 59.9 |
| Meade | 936 | 874 | 56 | 30.5 |
| Codington | 932 | 542 | 293 | 31.5 |
| Yankton | 809 | 338 | 419 | 34.2 |
Minnehaha County alone accounts for about 43% of the state's permitted units, and 60% of its units are in apartment buildings of five or more units. Minnehaha and Pennington together make up 60% of the statewide total.
Top 10 counties by units permitted per 1,000 residents, 2020–2025
| County | Per 1,000 residents | Units | Population (2025 est.) |
|---|---|---|---|
| Custer | 163.4 | 1,541 | 9,431 |
| Minnehaha | 86.3 | 18,347 | 212,691 |
| Lawrence | 62.2 | 1,832 | 29,459 |
| Pennington | 61.5 | 7,184 | 116,792 |
| Union | 59.9 | 1,043 | 17,402 |
| Hamlin | 52.2 | 360 | 6,900 |
| Sully | 46.7 | 69 | 1,479 |
| Lincoln | 38.3 | 2,958 | 77,145 |
| Lake | 35.3 | 388 | 10,993 |
| Yankton | 34.2 | 809 | 23,635 |
- Custer County has by far the highest rate. Almost all of its 1,541 units were single-family homes, roughly one new unit for every six residents.
- The Black Hills counties of Custer, Lawrence and Pennington, plus the Sioux Falls-area counties of Minnehaha, Union and Lincoln, all permitted more than the state average except Lincoln, at 38.
- Sully County ranks high on the rate because its population is small; its total is only 69 units.
Notes and caveats
- Missing or zero counties: Oglala Lakota and Ziebach have no rows in the survey for 2020–2025. That means the survey has no figure for them, not that no homes were built. Perkins, Corson and Jackson reported zero units. Buffalo reported zero but has rows for only 3 of the 6 years.
- What counts: only new privately owned housing in places that issue permits. Manufactured homes, conversions and public housing are not counted. A permit authorizes construction, and some permitted units are never built.
- Choice of population: the rate uses the 2025 population. Dividing by each year's population and averaging would rank fast-growing counties like Lincoln and Custer slightly higher.
Exploratory Queries
Query 1 — Check which permit and population years are available.
   SELECT (
             SELECT max(YEAR)
               FROM sd_bps_county_permits
          ) bps_max,
          (
             SELECT count(DISTINCT geoid)
               FROM sd_bps_county_permits
              WHERE YEAR BETWEEN 2020 AND 2025
          ) n_cty,
          (
             SELECT string_agg(DISTINCT YEAR::text, ',')
               FROM sd_bps_county_permits
              WHERE YEAR >= 2020
          ) yrs,
          (
             SELECT max(YEAR)
               FROM sd_census_county_pop_est
          ) pop_max
| bps_max | n_cty | yrs | pop_max |
|---|---|---|---|
| 2025 | 64 | 2020,2021,2022,2023,2024,2025 | 2025 |
Query 2 — Total 2020–2025 permitted units per county and per 1,000 residents (2025 population).
     WITH p AS (
             SELECT geoid,
                    sum(units_total) units,
                    sum(units_1) sf,
                    sum(units_5plus) mf5,
                    count(*) yrs
               FROM sd_bps_county_permits
              WHERE YEAR BETWEEN 2020 AND 2025
           GROUP BY geoid
          )
   SELECT c.name,
          c.geoid,
          coalesce(p.units, 0) units,
          p.sf,
          p.mf5,
          p.yrs,
          e.pop_estimate pop2025,
          round(1000.0 * coalesce(p.units, 0) / e.pop_estimate, 1) per1k
     FROM sd_census_counties c
     JOIN sd_census_county_pop_est e ON e.geoid = c.geoid
      AND e.year = 2025
LEFT JOIN p ON p.geoid = c.geoid
 ORDER BY units DESC
| name | geoid | units | sf | mf5 | yrs | pop2025 | per1k |
|---|---|---|---|---|---|---|---|
| Minnehaha County | 46099 | 18347 | 6890 | 11064 | 6 | 212691 | 86.3 |
| Pennington County | 46103 | 7184 | 2708 | 4250 | 6 | 116792 | 61.5 |
| Lincoln County | 46083 | 2958 | 1619 | 822 | 6 | 77145 | 38.3 |
| Lawrence County | 46081 | 1832 | 1399 | 321 | 6 | 29459 | 62.2 |
| Custer County | 46033 | 1541 | 1531 | 0 | 6 | 9431 | 163.4 |
| Brookings County | 46011 | 1140 | 735 | 260 | 6 | 37635 | 30.3 |
| Union County | 46127 | 1043 | 663 | 257 | 6 | 17402 | 59.9 |
| Meade County | 46093 | 936 | 874 | 56 | 6 | 30711 | 30.5 |
| Codington County | 46029 | 932 | 542 | 293 | 6 | 29562 | 31.5 |
| Yankton County | 46135 | 809 | 338 | 419 | 6 | 23635 | 34.2 |
| Brown County | 46013 | 754 | 422 | 280 | 6 | 37561 | 20.1 |
| Lake County | 46079 | 388 | 278 | 69 | 6 | 10993 | 35.3 |
| Butte County | 46019 | 361 | 348 | 0 | 6 | 10856 | 33.3 |
| Hamlin County | 46057 | 360 | 292 | 48 | 6 | 6900 | 52.2 |
| Davison County | 46035 | 352 | 240 | 21 | 6 | 20069 | 17.5 |
| Hughes County | 46065 | 279 | 148 | 115 | 6 | 17570 | 15.9 |
| Beadle County | 46005 | 243 | 150 | 75 | 6 | 19624 | 12.4 |
| Clay County | 46027 | 213 | 138 | 71 | 6 | 15031 | 14.2 |
| Day County | 46037 | 183 | 183 | 0 | 6 | 5484 | 33.4 |
| Roberts County | 46109 | 163 | 163 | 0 | 6 | 10255 | 15.9 |
| Charles Mix County | 46023 | 152 | 135 | 17 | 6 | 9303 | 16.3 |
| Turner County | 46125 | 150 | 112 | 0 | 6 | 9314 | 16.1 |
| Moody County | 46101 | 147 | 124 | 15 | 6 | 6632 | 22.2 |
| Kingsbury County | 46077 | 142 | 127 | 15 | 6 | 5284 | 26.9 |
| Marshall County | 46091 | 127 | 105 | 22 | 6 | 4426 | 28.7 |
25 out of 66 are listed here.
Query 3 — Statewide total permitted units and per-1,000 rate for context.
   SELECT sum(units_total) units,
          round(
          1000.0 * sum(units_total) / (
             SELECT pop_estimate
               FROM sd_census_county_pop_est
              WHERE geoid = '46000'
                AND YEAR = 2025
          ),
          1
          ) per1k,
          (
             SELECT sum(pop_estimate)
               FROM sd_census_county_pop_est
              WHERE YEAR = 2025
                AND geoid <> '46000'
          ) pop
     FROM sd_bps_county_permits
    WHERE YEAR BETWEEN 2020 AND 2025
| units | per1k | pop |
|---|---|---|
| 42392 | 935094 |
Map Layer Queries
Units permitted per 1,000 residents, 2020–2025 — colored by "cls": 60 or more (#08306b), 30–60 (#2171b5), 15–30 (#6baed6), 5–15 (#c6dbef), Under 5 (#f7fbff), No permit data in the survey (#bdbdbd)
     WITH p AS (
             SELECT geoid,
                    sum(units_total) units,
                    sum(units_1) sf,
                    sum(units_5plus) mf5
               FROM sd_bps_county_permits
              WHERE YEAR BETWEEN 2020 AND 2025
           GROUP BY geoid
          )
   SELECT c.geom,
          c.name AS "County",
          p.units AS "Units permitted 2020–2025",
          p.sf AS "Single-family units",
          p.mf5 AS "Units in 5+ unit buildings",
          e.pop_estimate AS "Population(July 2025 est.)",
          round(1000.0 * p.units / e.pop_estimate, 1) AS "Units per 1,000 residents",
          CASE
                    WHEN p.geoid IS NULL THEN 'none'
                    WHEN 1000.0 * p.units / e.pop_estimate >= 60 THEN 'a'
                    WHEN 1000.0 * p.units / e.pop_estimate >= 30 THEN 'b'
                    WHEN 1000.0 * p.units / e.pop_estimate >= 15 THEN 'c'
                    WHEN 1000.0 * p.units / e.pop_estimate >= 5 THEN 'd'
                    ELSE 'e'
          END AS cls
     FROM sd_census_counties c
     JOIN sd_census_county_pop_est e ON e.geoid = c.geoid
      AND e.year = 2025
LEFT JOIN p ON p.geoid = c.geoid
Picture: maps/turn-1-permits-per-1000.png
Used Data Sets
sd_bps_county_permits— last synced 2026-10-14 · 2,262 rowssd_census_counties— last synced 2026-09-27 · 66 rowssd_census_county_pop_est— last synced 2026-10-15 · 3,706 rows