State Planner

Tennessee · October 22, 2026

New Housing Units per 1,000 Residents, Tennessee Counties 2020-2025

This is a real answer State Planner produced from Tennessee’s public data.

Start for free to ask your own version of this question, or anything else about your state.

Start for free →
  1. Which Tennessee counties permitted the most new homes from 2020 through the latest year, how much of that was apartments of five units or more, and how does it compare with each county's population growth over the same years? Map new homes per 1,000 residents."

    I'll start with the permit table's columns and the county population table's columns.

    Next I'll check which years exist in each table and whether the county codes match.

    The latest permit year is 2025, and 94 of 95 counties appear in permits. I'll pull the 2020–2025 totals per county, joined to population at 2020 and 2025.

    The query failed because of a stray quote at the end of the SQL. Rerunning it corrected.

    Pickett County has no permit rows, and several counties show zero. I'll check whether those zeros hold across all years or reflect counties whose permit offices don't report.

    Zeros in Jackson, Morgan, Bledsoe, Hancock and Wayne are scattered, so those counties mostly show little or no permitting. Pickett has no rows at all. Next I'll map the per-1,000 rate in bands.

    The map is drawn. Next I'll get the chart guide before a stacked bar of the top counties by new homes.


    Where new homes were permitted, 2020–2025 (latest permit year is 2025)

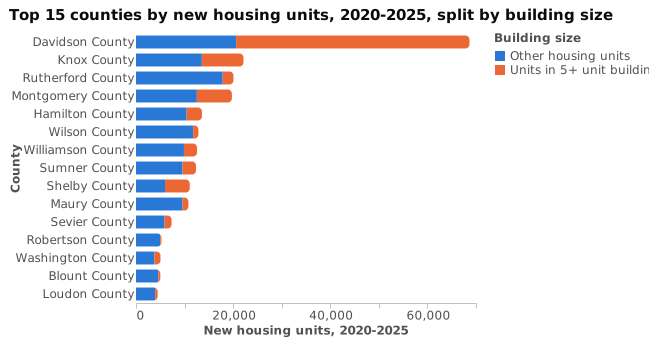
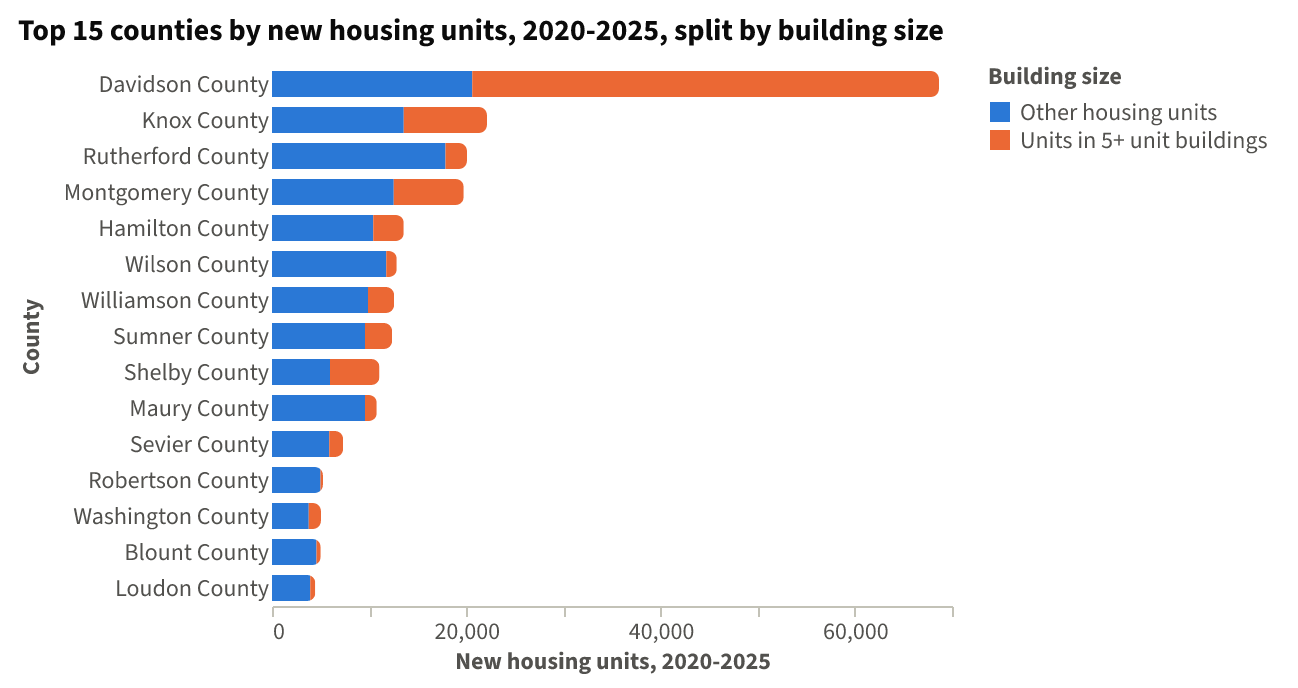
    Davidson, Knox, Rutherford, Montgomery and Hamilton permitted the most new homes in 2020–2025. Davidson alone accounts for about a quarter of the state's 295,540 units, and about half of the state's 89,921 units in buildings of five or more units.

    Top 10 counties by new housing units, 2020–2025

    CountyNew unitsIn 5+ unit buildings5+ shareUnits per 1,000 residents (2025)Population change 2020–2025
    Davidson68,65648,03870%92.0+4.2%
    Knox22,1268,57039%43.3+6.4%
    Rutherford20,0682,21711%51.9+12.5%
    Montgomery19,7377,20837%79.0+12.9%
    Hamilton13,5723,14623%34.7+6.2%
    Wilson12,8521,0878%73.4+17.7%
    Williamson12,5652,69221%46.2+9.0%
    Sumner12,3592,78623%57.3+9.2%
    Shelby11,0625,08946%12.2−2.1%
    Maury10,7931,21611%91.4+16.0%

    Population figures are Census July 1 estimates: 2020 (current release) and 2025.
    Top 15 counties by new housing units, 2020-2025, split by building size⬇ CSV⬇ Image

    The chart shows the top 15 counties' new units, split into 5+ unit buildings and everything else. Apartments make up the largest share in Davidson, Shelby and Montgomery; Wilson, Maury and Rutherford are mostly single-family and smaller buildings.

    Permits per 1,000 residents compared with population growth

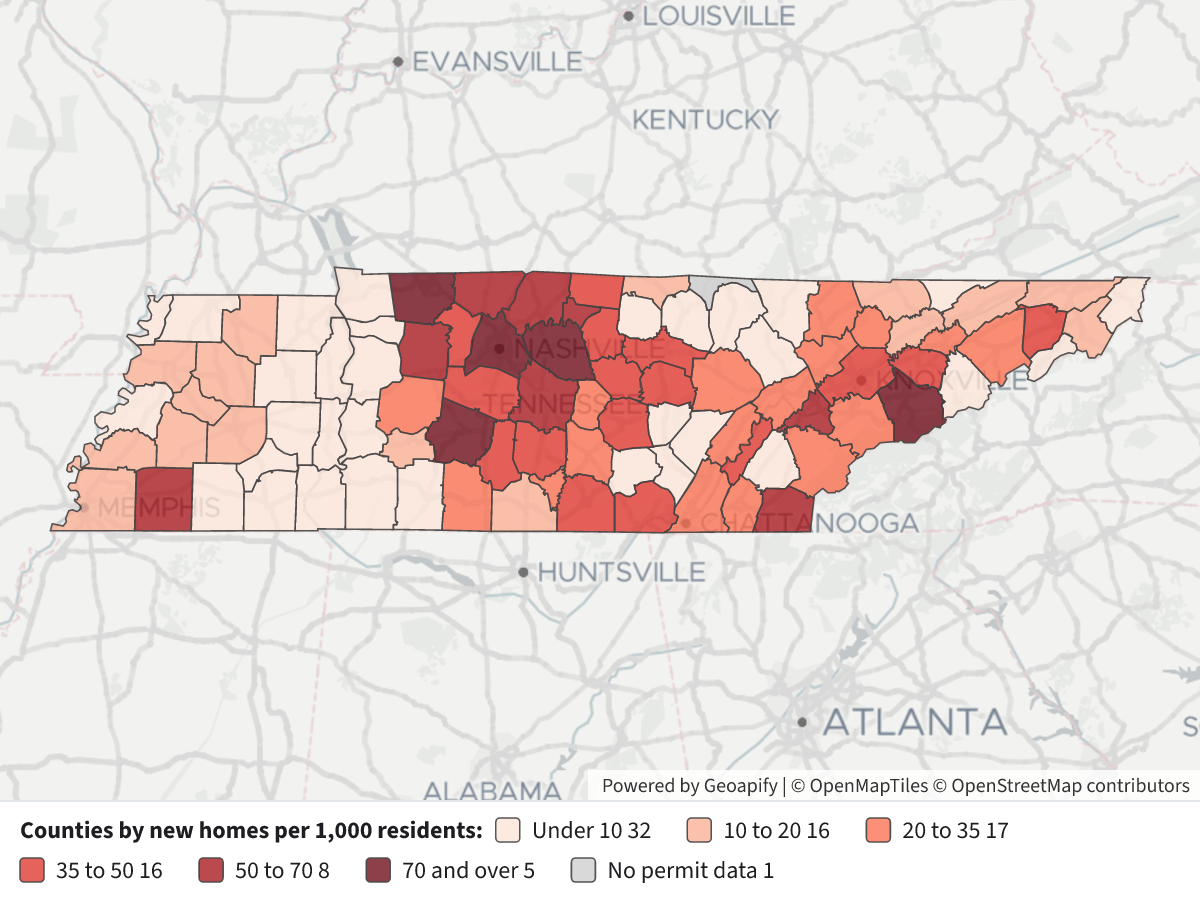
    • The highest rates are Davidson (92.0), Maury (91.4), Montgomery (79.0), Sevier (72.2), Wilson (73.4) and Loudon (69.9). Several of these also grew fast, notably Maury (+16.0%), Wilson (+17.7%) and Montgomery (+12.9%).
    • Davidson has the most units, but its rate sits near the top because its population is large. Its population grew only +4.2%, slower than the state's +5.6%.
    • Shelby permitted 11,062 units, but at 12.2 per 1,000 its rate is among the lowest of the large counties, and its population fell (−2.1%).
    • Sevier and Loudon permitted high rates with modest growth (+2.5% and +15.6%), so rate and growth do not always move together.
    New Housing Units per 1,000 Residents, Tennessee Counties 2020-2025New Housing Units per 1,000 Residents, Tennessee Counties 2020-2025⬇ Image

    Map legend: each county is shaded by its 2020–2025 new housing units per 1,000 residents in 2025. Darker red means more units per resident. Bands: under 10, 10–20, 20–35, 35–50, 50–70, 70 and over. Grey means no permit data (Pickett County has no rows in the permit table). Click a county for its totals and 2025 population.

    Notes and caveats

    • Permits are authorizations to build, not starts or completions. Some permitted units are never built.
    • "Per 1,000 residents" uses each county's 2025 population as the denominator for all six years of permits. Counties that grew over the period would show a somewhat higher rate using average population.
    • Population figures are Census estimates, not counts.
    • Jackson, Morgan, Bledsoe, Hancock and Wayne show near-zero permits; the table has few or zero permits there in most years, so their low rates are what the data reports.
    • The 5+ unit column counts housing units in buildings of five or more units, the apartment category, not buildings.

Layers

  • …
    • …
    • …
    • …
    • …
    • …
    • …
    • …

Click anything on the map for its details.

The transcript below the answer shows every query it ran. Shapefiles of every layer, at full detail, can be downloaded in State Planner: sign up to ask your own question and export any map.

Ask your own question about Tennessee

Send takes you to a free sign-up, no card needed, or to sign in if you have an account. Your question will be waiting in your new chat.

Transcript

What follows is the transcript of this chat as State Planner generated it. It is here to show how the answer above was arrived at: every query State Planner ran, what each one returned, and where the data came from.

transcript.md

↑ Contents

State Planner chat · https://stateplanner.com

  • State: Tennessee (TN)
  • Started: October 22, 2026, 12:27 AM UTC
  • Runtime: 42 sec
  • Status: completed
Prompt

Which Tennessee counties permitted the most new homes from 2020 through the latest year, how much of that was apartments of five units or more, and how does it compare with each county's population growth over the same years? Map new homes per 1,000 residents."

Model: Anthropic: Claude Haiku 5.5 (anthropic/claude-haiku-5.5, via openrouter)

Response

I'll start with the permit table's columns and the county population table's columns.

Next I'll check which years exist in each table and whether the county codes match.

The latest permit year is 2025, and 94 of 95 counties appear in permits. I'll pull the 2020–2025 totals per county, joined to population at 2020 and 2025.

The query failed because of a stray quote at the end of the SQL. Rerunning it corrected.

Pickett County has no permit rows, and several counties show zero. I'll check whether those zeros hold across all years or reflect counties whose permit offices don't report.

Zeros in Jackson, Morgan, Bledsoe, Hancock and Wayne are scattered, so those counties mostly show little or no permitting. Pickett has no rows at all. Next I'll map the per-1,000 rate in bands.

The map is drawn. Next I'll get the chart guide before a stacked bar of the top counties by new homes.


Where new homes were permitted, 2020–2025 (latest permit year is 2025)

Davidson, Knox, Rutherford, Montgomery and Hamilton permitted the most new homes in 2020–2025. Davidson alone accounts for about a quarter of the state's 295,540 units, and about half of the state's 89,921 units in buildings of five or more units.

Top 10 counties by new housing units, 2020–2025

CountyNew unitsIn 5+ unit buildings5+ shareUnits per 1,000 residents (2025)Population change 2020–2025
Davidson68,65648,03870%92.0+4.2%
Knox22,1268,57039%43.3+6.4%
Rutherford20,0682,21711%51.9+12.5%
Montgomery19,7377,20837%79.0+12.9%
Hamilton13,5723,14623%34.7+6.2%
Wilson12,8521,0878%73.4+17.7%
Williamson12,5652,69221%46.2+9.0%
Sumner12,3592,78623%57.3+9.2%
Shelby11,0625,08946%12.2−2.1%
Maury10,7931,21611%91.4+16.0%

Population figures are Census July 1 estimates: 2020 (current release) and 2025.

Top 15 counties by new housing units, 2020-2025, split by building size

The chart shows the top 15 counties' new units, split into 5+ unit buildings and everything else. Apartments make up the largest share in Davidson, Shelby and Montgomery; Wilson, Maury and Rutherford are mostly single-family and smaller buildings.

Permits per 1,000 residents compared with population growth

  • The highest rates are Davidson (92.0), Maury (91.4), Montgomery (79.0), Sevier (72.2), Wilson (73.4) and Loudon (69.9). Several of these also grew fast, notably Maury (+16.0%), Wilson (+17.7%) and Montgomery (+12.9%).
  • Davidson has the most units, but its rate sits near the top because its population is large. Its population grew only +4.2%, slower than the state's +5.6%.
  • Shelby permitted 11,062 units, but at 12.2 per 1,000 its rate is among the lowest of the large counties, and its population fell (−2.1%).
  • Sevier and Loudon permitted high rates with modest growth (+2.5% and +15.6%), so rate and growth do not always move together.

New housing units per 1,000 residents, 2020-2025

Map legend: each county is shaded by its 2020–2025 new housing units per 1,000 residents in 2025. Darker red means more units per resident. Bands: under 10, 10–20, 20–35, 35–50, 50–70, 70 and over. Grey means no permit data (Pickett County has no rows in the permit table). Click a county for its totals and 2025 population.

Notes and caveats

  • Permits are authorizations to build, not starts or completions. Some permitted units are never built.
  • "Per 1,000 residents" uses each county's 2025 population as the denominator for all six years of permits. Counties that grew over the period would show a somewhat higher rate using average population.
  • Population figures are Census estimates, not counts.
  • Jackson, Morgan, Bledsoe, Hancock and Wayne show near-zero permits; the table has few or zero permits there in most years, so their low rates are what the data reports.
  • The 5+ unit column counts housing units in buildings of five or more units, the apartment category, not buildings.
Chart Queries
Top 15 counties by new housing units, 2020-2025, split by building size
     WITH perm AS (
             SELECT c.name,
                    sum(p.units_5plus) AS "Apartments 5+ units",
                    sum(p.units_total) - sum(p.units_5plus) AS "Other units"
               FROM tn_bps_county_permits p
               JOIN tn_census_counties c ON c.geoid = p.geoid
              WHERE p.year BETWEEN 2020 AND 2025
           GROUP BY c.name
           ORDER BY sum(p.units_total) DESC
              LIMIT 15
          )
   SELECT name AS "County",
          "Other units" AS "Other housing units",
          "Apartments 5+ units" AS "Units in 5+ unit buildings"
     FROM perm,
          LATERAL (
             VALUES (1)
          ) v(x)
 ORDER BY "Apartments 5+ units" + "Other units" DESC

charts/turn-1-top-counties-permits-5plus.csv

Picture: charts/turn-1-top-counties-permits-5plus.png

Exploratory Queries
Query 1 — Check which permit years exist from 2019 on and totals per year
   SELECT p.year,
          count(*) AS counties,
          sum(p.units_total) AS units,
          sum(p.units_5plus) AS units_5plus
     FROM tn_bps_county_permits p
    WHERE p.year >= 2019
 GROUP BY p.year
 ORDER BY p.year
yearcountiesunitsunits_5plus
2019944136111262
2020944971915612
2021945748419690
2022945263717973
2023944746315036
2024944486311183
2025944337410427

data/turn-1-query-1.csv

Query 2 — Check population estimate years available from 2019 on
   SELECT YEAR,
          series,
          count(*) AS counties,
          sum(pop_estimate) AS pop
     FROM tn_census_county_pop_est
    WHERE YEAR >= 2019
 GROUP BY YEAR,
          series
 ORDER BY YEAR
yearseriescountiespop
2019intercensal956862615
2020postcensal956927736
2021postcensal956966687
2022postcensal957063325
2023postcensal957153029
2024postcensal957251291
2025postcensal957315076

data/turn-1-query-2.csv

Query 3 — Per-county permits 2020-2025, 5+ share, population change and permits per 1,000
     WITH perm AS (
             SELECT geoid,
                    sum(units_total) AS units,
                    sum(units_5plus) AS units_5plus
               FROM tn_bps_county_permits
              WHERE YEAR BETWEEN 2020 AND 2025
           GROUP BY geoid
          ),
          pop AS (
             SELECT geoid,
                    max(pop_estimate) FILTER (
                        WHERE YEAR = 2025
                    ) AS pop_2025,
                    max(pop_estimate) FILTER (
                        WHERE YEAR = 2020
                    ) AS pop_2020
               FROM tn_census_county_pop_est
              WHERE YEAR IN (2020, 2025)
           GROUP BY geoid
          )
   SELECT c.geoid,
          c.name AS county,
          p.units AS units,
          p.units_5plus AS units_5plus,
          round(100.0 * p.units_5plus / nullif(p.units, 0), 1) AS share_5plus,
          round(1000.0 * p.units / nullif(pp.pop_2025, 0), 1) AS per_1000,
          pp.pop_2020,
          pp.pop_2025,
          round(100.0 * (pp.pop_2025 - pp.pop_2020) / nullif(pp.pop_2020, 0), 1) AS pop_chg_pct
     FROM tn_census_counties c
LEFT JOIN perm p ON p.geoid = c.geoid
LEFT JOIN pop pp ON pp.geoid = c.geoid
 ORDER BY p.units DESC NULLS LAST
geoidcountyunitsunits_5plusshare_5plusper_1000pop_2020pop_2025pop_chg_pct
47037Davidson County686564803870.092.07161537459044.2
47093Knox County22126857038.743.34804725114536.4
47149Rutherford County20068221711.051.934328538635212.5
47125Montgomery County19737720836.579.022128624993512.9
47065Hamilton County13572314623.234.73678863908336.2
47189Wilson County1285210878.573.414865417503317.7
47187Williamson County12565269221.446.22496142720619.0
47165Sumner County12359278622.557.31974162155389.2
47157Shelby County11062508946.012.2929720910226-2.1
47119Maury County10793121611.391.410181211813116.0
47155Sevier County7319143619.672.2988481013422.5
47147Robertson County52392444.765.372958801759.9
47179Washington County5036125124.835.71332111411996.0
47009Blount County50114238.434.81356661438206.0
47105Loudon County445951711.669.9551446376415.6
47011Bradley County3931621.634.01088321154656.1
47141Putnam County371938910.542.980101866128.1
47163Sullivan County320049015.319.51582381637593.5
47043Dickson County305443014.152.154452586627.7
47003Bedford County257460.246.650381552739.7
47001Anderson County251390436.030.677347820666.1
47047Fayette County237400.052.741868450717.7
47051Franklin County2243200.949.242842455796.4
47089Jefferson County2180321.536.354897600249.3
47063Hamblen County20181889.329.364553688436.6

25 out of 95 are listed here.

data/turn-1-query-3.csv

Query 4 — Check whether zero-permit counties have zero or missing rows in all years
   SELECT name,
          count(*) AS years_present,
          sum(units_total) AS units_all_years,
          min(units_total) AS min_yr,
          max(units_total) AS max_yr
     FROM tn_bps_county_permits
    WHERE name ILIKE ANY (
          ARRAY['Jackson%', 'Morgan%', 'Bledsoe%', 'Pickett%', 'Hancock%', 'Wayne%']
          )
 GROUP BY name
 ORDER BY name
nameyears_presentunits_all_yearsmin_yrmax_yr
Bledsoe County11000
Hancock County36140049
Jackson County251208
Morgan County3643019
Wayne County36328080

data/turn-1-query-4.csv

Map Layer Queries
Counties by new homes per 1,000 residents — colored by "Rate band": Under 10 (#fee5d9), 10 to 20 (#fcae91), 20 to 35 (#fb6a4a), 35 to 50 (#de2d26), 50 to 70 (#a50f15), 70 and over (#67000d), No permit data (#cccccc)
     WITH perm AS (
             SELECT geoid,
                    sum(units_total) AS units,
                    sum(units_5plus) AS units_5plus
               FROM tn_bps_county_permits
              WHERE YEAR BETWEEN 2020 AND 2025
           GROUP BY geoid
          ),
          pop AS (
             SELECT geoid,
                    max(pop_estimate) FILTER (
                        WHERE YEAR = 2025
                    ) AS pop_2025,
                    max(pop_estimate) FILTER (
                        WHERE YEAR = 2020
                    ) AS pop_2020
               FROM tn_census_county_pop_est
              WHERE YEAR IN (2020, 2025)
           GROUP BY geoid
          ),
          x AS (
             SELECT c.name,
                    c.geom,
                    p.units,
                    p.units_5plus,
                    pp.pop_2020,
                    pp.pop_2025,
                    1000.0 * p.units / nullif(pp.pop_2025, 0) AS per_1000
               FROM tn_census_counties c
          LEFT JOIN perm p ON p.geoid = c.geoid
          LEFT JOIN pop pp ON pp.geoid = c.geoid
          )
   SELECT geom,
          name AS "County",
          units AS "New housing units 2020-2025",
          units_5plus AS "Units in 5+ unit buildings",
          round(per_1000::numeric, 1) AS "Units per 1,000 residents",
          pop_2025 AS "Population 2025",
          CASE
                    WHEN per_1000 IS NULL THEN 'No permit data'
                    WHEN per_1000 < 10 THEN 'Under 10'
                    WHEN per_1000 < 20 THEN '10 to 20'
                    WHEN per_1000 < 35 THEN '20 to 35'
                    WHEN per_1000 < 50 THEN '35 to 50'
                    WHEN per_1000 < 70 THEN '50 to 70'
                    ELSE '70 and over'
          END AS "Rate band"
     FROM x

Picture: maps/turn-1-permits-per-thousand-counties.png

Used Data Sets

data/turn-1-query-1.csv

↑ Contents
yearcountiesunitsunits_5plus
2019944136111262
2020944971915612
2021945748419690
2022945263717973
2023944746315036
2024944486311183
2025944337410427

7 rows.

data/turn-1-query-2.csv

↑ Contents
yearseriescountiespop
2019intercensal956862615
2020postcensal956927736
2021postcensal956966687
2022postcensal957063325
2023postcensal957153029
2024postcensal957251291
2025postcensal957315076

7 rows.

data/turn-1-query-3.csv

↑ Contents
geoidcountyunitsunits_5plusshare_5plusper_1000pop_2020pop_2025pop_chg_pct
47037Davidson County686564803870.092.07161537459044.2
47093Knox County22126857038.743.34804725114536.4
47149Rutherford County20068221711.051.934328538635212.5
47125Montgomery County19737720836.579.022128624993512.9
47065Hamilton County13572314623.234.73678863908336.2
47189Wilson County1285210878.573.414865417503317.7
47187Williamson County12565269221.446.22496142720619.0
47165Sumner County12359278622.557.31974162155389.2
47157Shelby County11062508946.012.2929720910226-2.1
47119Maury County10793121611.391.410181211813116.0
47155Sevier County7319143619.672.2988481013422.5
47147Robertson County52392444.765.372958801759.9
47179Washington County5036125124.835.71332111411996.0
47009Blount County50114238.434.81356661438206.0
47105Loudon County445951711.669.9551446376415.6
47011Bradley County3931621.634.01088321154656.1
47141Putnam County371938910.542.980101866128.1
47163Sullivan County320049015.319.51582381637593.5
47043Dickson County305443014.152.154452586627.7
47003Bedford County257460.246.650381552739.7
47001Anderson County251390436.030.677347820666.1
47047Fayette County237400.052.741868450717.7
47051Franklin County2243200.949.242842455796.4
47089Jefferson County2180321.536.354897600249.3
47063Hamblen County20181889.329.364553688436.6
47035Cumberland County201500.030.461381663008.0
47031Coffee County197420410.331.658132624197.4
47021Cheatham County181021712.042.341088427784.1
47117Marshall County177018010.246.5344673807110.5
47059Greene County1585724.521.570339738315.0
47177Warren County157224215.436.041057437176.5
47113Madison County151200.015.0988321007902.0
47115Marion County129400.043.428874298043.2
47013Campbell County1257141.131.239310402902.5
47139Polk County123400.066.417558185925.9
47167Tipton County1231715.819.861050622872.0
47145Roane County119800.020.953666573956.9
47185White County111600.037.727441296127.9
47123Monroe County108400.021.846399497307.2
47019Carter County105700.018.456391573611.7
47053Gibson County102400.019.850443517792.6
47111Macon County97216016.535.125260276639.5
47073Hawkins County95200.016.056715595595.0
47143Rhea County860465.324.733302348444.6
47041DeKalb County83900.038.420186218738.4
47159Smith County788557.037.619963209815.1
47055Giles County77400.024.630346314333.6
47173Union County72900.034.019847214508.1
47081Hickman County69700.026.624972262195.0
47169Trousdale County65800.052.111646126238.4
47121Meigs County59000.041.6128081418610.8
47025Claiborne County52961.115.932075332293.6
47103Lincoln County50400.013.735332368534.3
47107McMinn County45461.37.953347574047.6
47057Grainger County41800.016.223572257399.2
47015Cannon County40800.026.714564152965.0
47045Dyer County39961.511.03671036320-1.1
47183Weakley County39500.011.932908332611.1
47069Hardeman County24500.09.72543525274-0.6
47085Humphreys County19200.09.818998196463.4
47075Haywood County1887238.311.01782717042-4.4
47033Crockett County17600.012.613907140060.7
47127Moore County17600.025.4647269206.9
47101Lewis County1745632.212.912609134877.0
47131Obion County16400.05.53077930067-2.3
47097Lauderdale County15800.06.42511524617-2.0
47027Clay County15100.019.3758878213.1
47071Hardin County14900.05.326948279833.8
47099Lawrence County13300.02.844185469146.2
47077Henderson County13300.04.727833285182.5
47079Henry County11900.03.632149328962.3
47171Unicoi County11800.06.61787317856-0.1
47109McNairy County1176656.44.525868262361.4
47023Chester County10500.05.817379179943.5
47153Sequatchie County9800.05.5158481786112.7
47133Overton County8700.03.722590237875.3
47135Perry County6800.07.5838391268.9
47061Grundy County6600.04.713541141164.2
47017Carroll County6600.02.328427292002.7
47161Stewart County57712.33.913708144395.3
47005Benton County4500.02.815847161832.1
47151Scott County3500.01.521880226713.6
47039Decatur County3200.02.711429118203.4
47029Cocke County3100.00.836043378895.1
47175Van Buren County3000.04.46174687411.3
47091Johnson County2600.01.417985187184.1
47095Lake County1600.02.669886249-10.6
47049Fentress County1500.00.718533203229.7
47083Houston County500.00.6829584792.2
47067Hancock County400.00.6662870756.7
47181Wayne County200.00.116220164161.2
47087Jackson County000.011637124667.1
47129Morgan County000.021051221605.3
47007Bledsoe County000.014945159206.5
47137Pickett County500252194.3

95 rows.

data/turn-1-query-4.csv

↑ Contents
nameyears_presentunits_all_yearsmin_yrmax_yr
Bledsoe County11000
Hancock County36140049
Jackson County251208
Morgan County3643019
Wayne County36328080

5 rows.

charts/turn-1-top-counties-permits-5plus.csv

↑ Contents
CountyOther housing unitsUnits in 5+ unit buildings
Davidson County2061848038
Knox County135568570
Rutherford County178512217
Montgomery County125297208
Hamilton County104263146
Wilson County117651087
Williamson County98732692
Sumner County95732786
Shelby County59735089
Maury County95771216
Sevier County58831436
Robertson County4995244
Washington County37851251
Blount County4588423
Loudon County3942517

15 rows.

provenance/tn_bps_county_permits.md

↑ Contents

Provenance: tn_bps_county_permits

This file describes how the rows in PostgreSQL table tn_bps_county_permits were obtained from an external source: where they were fetched and how fields were renamed and typed. Field meanings are in the mapping table below.

Identity
  • Table: tn_bps_county_permits
  • Family: BPS
  • Display name: Building Permits by County
  • Source URL: https://www2.census.gov/econ/bps/County/ (co<year>a.txt, 1990 on)
  • Geometry (source / stored): none / none
  • Update cycle: Yearly (each May)
Pipeline

The Building Permits Survey publishes one national county file per year, the annual summary (a), comma-delimited text with a two-row header. Every year from 1990 is loaded; the newest year is the one before the current, once the Bureau has published it. Each year's file is downloaded whole and kept; the sync keeps Tennessee's rows (FIPS State 47) and checks each file's survey date names its year (2024, or 9099 in the 1990s files).

A county listed twice in one year (the 2014 and 2015 files repeat four Alaska boroughs and one Maryland county under a second name with the same estimates) keeps the row with more reported units; two rows with different estimates fail the sync. The monthly and year-to-date files are not loaded.

Changed from the source: cut to Tennessee; reshaped to one row per county per year; the three totals added; the region, division and survey-date columns dropped (doc/BPS-SYNC.md).

No licence terms: a work of the U.S. Government, credited to the U.S. Census Bureau (doc/DATA-LICENSES.md).

Field → column mapping
Source fieldColumnTypeDescription
FIPS State, FIPS CountygeoidtextTwo digits and three, joined
County NamenametextTrailing spaces trimmed
Survey Dateyeartext → integerChecked against the file's year
1-unit Bldgs, Units, Valuebldgs_1, units_1, value_1integerEstimates with imputation
2-units Bldgs, Units, Valuebldgs_2, units_2, value_2integer
3-4 units Bldgs, Units, Valuebldgs_3_4, units_3_4, value_3_4integer
5+ units Bldgs, Units, Valuebldgs_5plus, units_5plus, value_5plusinteger
1-unit rep … 5+ units reprep_bldgs_1 … rep_value_5plusintegerReported only
(computed)bldgs_total, units_total, value_totalThe four estimate sizes added
Region Code, Division Code(dropped)

provenance/tn_census_counties.md

↑ Contents

Provenance: tn_census_counties

This file describes how the rows in PostgreSQL table tn_census_counties were obtained from an external source: where they were fetched and how fields were renamed and typed. Field meanings are in the mapping table below.

Identity
Pipeline

Two Census Bureau sources, joined on the county's 5-digit FIPS code:

  • Boundaries: TIGERweb tigerWMS_Current layer 82 ("Counties"), where=STATE='47', GeoJSON, outSR=4326, keyset-paged on GEOID.
  • CFS areas: sheet CFSAreas of the 2022 Commodity Flow Survey county list, the Tennessee rows (ST = 47). Only the 2022 columns are kept.

The two must name the same counties, or the sync fails. FAF's tn_faf_county_xwalk is built from this table: each county's cfs_geoid is the CFS22_ID of one FAF6 zone.

Field → column mapping
Source fieldColumnTypeDescription
TIGER GEOIDgeoidvarchar(5)state + county FIPS
TIGER GEOID, last 3county_fipsvarchar(3)county FIPS
TIGER NAMEnamevarchar(60)e.g. Shelby County
CFS CFS22_AREAcfs_areavarchar(5)CSA/MSA code, or 99999
CFS CFS22_TYPEcfs_area_typevarchar(1)C, M or R
CFS CFS22_NAME, whitespace collapsedcfs_area_namevarchar(120)the workbook pads some names with doubled and trailing spaces
CFS CFS22_GEOIDcfs_geoidvarchar(19)e.g. E330000US4736800000
TIGER AREALANDaland_m2bigintsquare meters
TIGER AREAWATERawater_m2bigintsquare meters
TIGER INTPTLATintptlatdouble precisioninternal point
TIGER INTPTLONintptlondouble precisioninternal point
geometrygeomgeometry(MultiPolygon, 4326)ST_Multi(ST_GeomFromGeoJSON)
Geometry
  • SRID 4326 (WGS84). GIST index on geom.
Change detection

The Census sync's check compares the layer's vintage ("January 1, 2026 vintage") and Tennessee's row count, and the county list's Last-Modified and length. A change to either marks Census stale, and the next Census sync rebuilds this table, then FAF's crosswalk.

Attribution

US Census Bureau. TIGER products are free to use with acknowledgement of the U.S. Census Bureau as the source; the CFS county list states no terms.

provenance/tn_census_county_pop_est.md

↑ Contents

Provenance: tn_census_county_pop_est

This file describes how the rows in PostgreSQL table tn_census_county_pop_est were obtained from an external source: where they were fetched and how fields were renamed and typed. Field meanings are in the mapping table below.

Identity
  • Table: tn_census_county_pop_est
  • Family: Census
  • Display name: Annual Population Estimates by County
  • Source URL: https://www2.census.gov/programs-surveys/popest/datasets/2020-2025/counties/totals/co-est2025-alldata.csv (vintage 2025; each vintage <V> is 2020-<V>/counties/totals/co-est<V>-alldata.csv), for 2020 on
  • History (2000–2019): under the same datasets/ directory, 2000-2010/intercensal/county/co-est00int-tot.csv and 2010-2020/intercensal/county/asrh/cc-est2020int-agesex-all.csv (the revised population), 2010/2010-eval-estimates/co-est2010-alldata.csv and 2010-2020/counties/totals/co-est2020-alldata.csv (the components of change of the releases they revised)
  • History (1970–1999): under https://www2.census.gov/programs-surveys/popest/tables/, 1900-1980/counties/asrh/co-asr-7079.csv, 1980-1990/counties/asrh/pe-02-<year>.csv and 1990-2000/intercensal/st-co/stch-icen<year>.txt (the county age, sex and race estimates), and 1900-1980/counties/totals/e7079co.txt and 1980-1990/counties/totals/e8089co.txt (the decades' county totals tables, for their census counts)
  • Geometry (source / stored): none / none
  • Update cycle: Yearly (each March)
Pipeline

The Population Estimates Program's national county file, CSV, one row per county with a column per year for each figure. The sync keeps Tennessee's county rows (SUMLEV 050, STATE 47), dropping the state's own total (040), and turns each into one row per year, the years read off the file's POPESTIMATE<year> columns. Every county the file names must be one the county layer of TIGERweb draws, or the sync fails. A file that is not valid UTF-8 is read as Latin-1. These rows are series postcensal.

The years before 2020 are series intercensal, from four further national files that never change:

  • Population, 2000–2009: co-est00int-tot.csv, one row per county, codes written without leading zeros (SUMLEV "50", STATE "1"), which the sync pads. ESTIMATESBASE2000 and POPESTIMATE2000–2009; its POPESTIMATE2010 and CENSUS2010POP are not loaded. vintage 2010.
  • Population, 2010–2019: the Bureau's table of revised county totals for the decade is a spreadsheet that names counties without codes, so the sync reads the same figures from cc-est2020int-agesex-all.csv, one row per county and YEAR code, its POPESTIMATE the whole population: YEAR 1 is the April 1, 2010 base, 2–11 July 1, 2010–2019, and 12 (the April 1, 2020 census) is not loaded. vintage 2020. 2010 is taken from this file, not the 2000s one, which has its own figure for it.
  • Components: the original releases' files, as published, matched by county code: co-est2010-alldata.csv for 2000–2010 (2000 is April to June) and co-est2020-alldata.csv for 2011–2019. Their natural change column is NATURALINC<year>. A county with no row in the 2000s release (one coded anew in the 2010s) has empty 2010 components; any other missing county fails the sync.
  • pop_change is computed, not read: pop_estimate less the row before's (2010's less the 2000s file's 2009, 2000's less 1999's, or ESTIMATESBASE2000 for a county with no 1999 row). The releases' NPOPCHG_<year> describes their own population, not the revised one, and is not loaded.
  • 1970–1999: each county's July 1 population is the sum of its age, sex and race estimates, which tn_census_county_pop_char loads from the same files (its provenance has their layouts): vintage 1980, 1990 and 2000 for the three decades. The Bureau's county totals tables for the 1970s and 1980s, e7079co.txt and e8089co.txt, are fixed-width text in blocks of five years, a long name wrapping onto a line of its own; only their first column, the decade's April 1 census, is loaded, into estimates_base on the 1970 and 1980 rows. Their July figures are not loaded: the 1970s table rounds counties to hundreds, and both are on the geography of their day as the age files are, but not always the same day's. No component of change is loaded before 2000. pop_change is computed as for the later decades, 1970's from the April 1970 count, and the 2000 row's is from July 1999.
  • A history row's county need not be one TIGER draws today (Connecticut's eight old counties, the 1970s' Alaskan census divisions and Virginia's Nansemond, and a handful elsewhere); the sync logs them.
Field → column mapping
Source fieldColumnTypeDescription
STATE + COUNTYgeoidvarchar(5)county FIPS
the <year> suffixyearsmallint
the newest <year>vintagesmallint1980, 1990, 2000, 2010 or 2020 on history rows
seriesvarchar(12)postcensal, or intercensal on history rows
POPESTIMATE<year>pop_estimateinteger
ESTIMATESBASE2020estimates_baseinteger2020 row only (ESTIMATESBASE2000, YEAR 1 on the 2000 and 2010 rows; the decade tables' census column on the 1970 and 1980 rows)
NPOPCHG<year>pop_changeintegercomputed on history rows
BIRTHS<year>birthsinteger
DEATHS<year>deathsinteger
NATURALCHG<year>natural_changeintegerNATURALINC<year> on history rows
INTERNATIONALMIG<year>international_miginteger
DOMESTICMIG<year>domestic_miginteger
NETMIG<year>net_miginteger
RESIDUAL<year>residualinteger
GQESTIMATES<year>gq_estimateinteger

The file's per-1,000 rate columns (R…) and GQESTIMATESBASE2020 are not loaded.

Geometry
  • No geometry column.
Change detection

The Census sync's check asks for the next vintage's file each time and moves to it once it is published; otherwise it compares the current file's Last-Modified and length, and each history file's. Any of them marks this table stale, and the next Census sync rebuilds it whole, every year from 2020 replaced by the new release.

Attribution

US Census Bureau, Population Estimates Program.

© 2026 State Planner