State Planner

Tennessee · October 22, 2026

Housing Permits vs School Enrollment Change

This is a real answer State Planner produced from Tennessee’s public data.

Start for free to ask your own version of this question, or anything else about your state.

Start for free →
  1. Which Tennessee school districts gained or lost the most students since 2017–18? Map the schools by enrollment change, and say whether the gains are in the counties permitting the most new homes.

    Now a county map setting permits beside enrollment change.


    District enrollment change, 2017‑18 to 2024‑25 (NCES Common Core of Data)

    Statewide, public school enrollment barely changed: 1,001,967 students in fall 2017 and 1,002,363 in fall 2024. Seven schools in 2017‑18 and 15 in 2024‑25 reported no enrollment and are left out of the totals. Underneath that flat total, students shifted between districts.

    Districts with the largest gains

    District2017‑182024‑25Change%
    Tennessee Public Charter School Commission–6,979+6,979new
    Rutherford County45,29252,127+6,835+15.1%
    Montgomery County34,84139,385+4,544+13.0%
    Johnson County*2,1104,952+2,842+134.7%
    Wilson County18,34320,703+2,360+12.9%
    Williamson County39,32241,593+2,271+5.8%
    Lewis County*1,7253,731+2,006+116.3%
    Memphis‑Shelby County Schools109,591111,125+1,534+1.4%
    Union County*4,2075,514+1,307+31.1%
    Hamilton County44,82245,981+1,159+2.6%

    Districts with the largest losses

    District2017‑182024‑25Change%
    Achievement School District11,4191,412−10,007−87.6%
    Davidson County (Metro Nashville)84,72881,022−3,706−4.4%
    Sullivan County9,7587,878−1,880−19.3%
    Tipton County11,1149,975−1,139−10.2%
    Lauderdale County4,1593,277−882−21.2%
    Carter County5,2904,450−840−15.9%
    Cheatham County6,2775,451−826−13.2%
    Greene County6,7836,088−695−10.2%
    Hawkins County6,7056,038−667−9.9%
    Fayette County3,5602,909−651−18.3%

    * Johnson, Lewis and Union counties grew because of full‑virtual schools they host. Tennessee Connections Academy has about 3,000 students in Johnson County, Volunteer State Virtual Academy about 2,000 in Lewis, and Tennessee Virtual Academy and its junior high about 2,700 in Union. Those students live all over the state. Leave the virtual schools out and all three counties are roughly flat or down.

    Two of the biggest moves are students changing district rather than arriving or leaving:

    • The Achievement School District's large loss mostly matches the new Charter Commission district and Memphis‑Shelby's gain.
    • Counted by where the schools are, Davidson County lost only about 700 students, not 3,700, because the Charter Commission's schools sit mostly in Nashville.

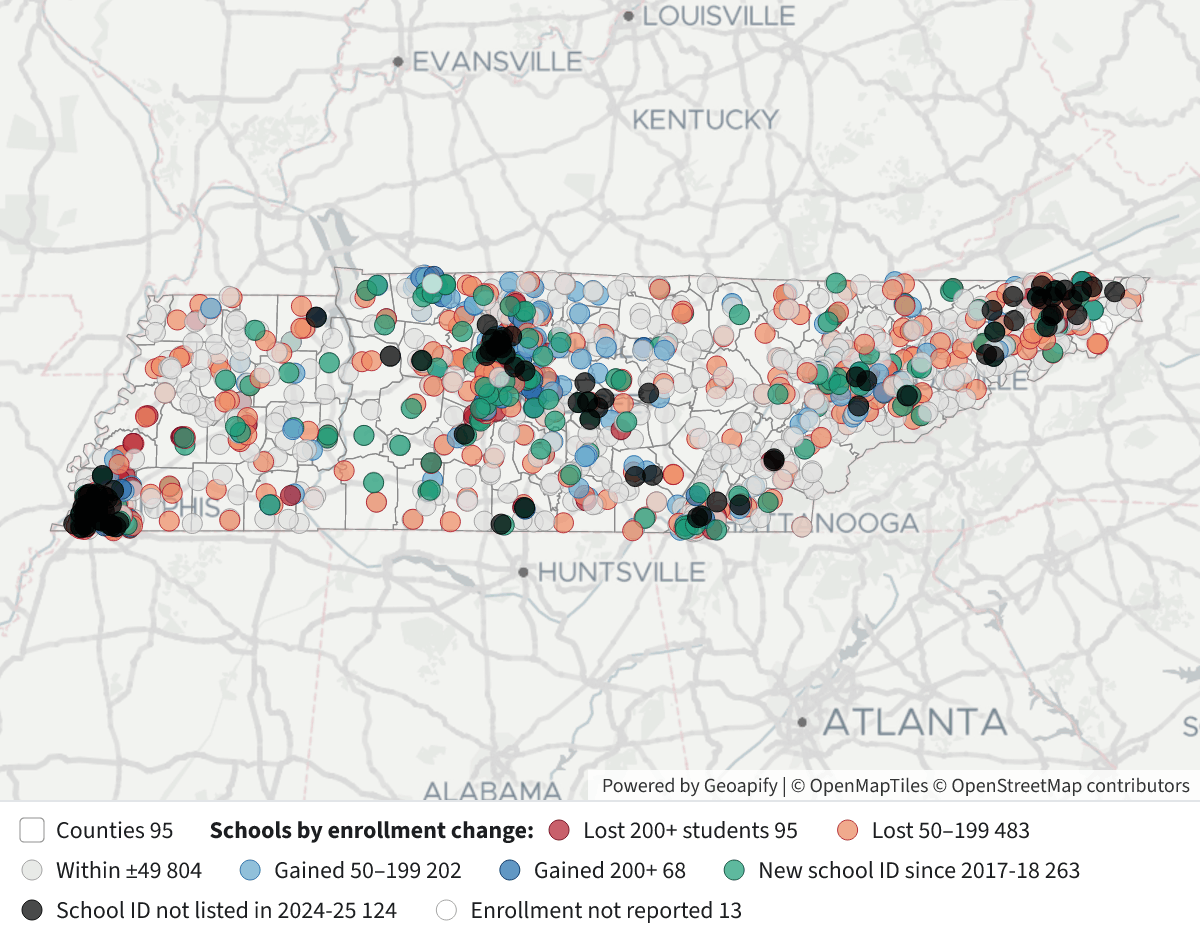
    Schools by enrollment change

    School Enrollment Change 2017-18 to 2024-25School Enrollment Change 2017-18 to 2024-25⬇ Image

    Map legend (each school is matched to itself by its NCES school ID):

    • Dark blue: gained 200 or more students (68 schools)
    • Light blue: gained 50–199 (202)
    • Grey: changed by fewer than 50 (804)
    • Orange: lost 50–199 (483)
    • Dark red: lost 200 or more (95)
    • Green: school ID new since 2017‑18 (263 schools, about 82,500 students)
    • Black: school ID not listed in 2024‑25 (124 schools that had about 36,200 students)
    • White: enrollment not reported in one of the two years

    A school's ID changes when it moves to another district, as when schools left the Achievement School District, so some green and black dots are the same building under a new operator. Many of the gains among existing schools are in Rutherford, Montgomery, Wilson and Williamson counties. Losses are spread widely across rural counties.

    Are the gains where the most homes are being permitted?

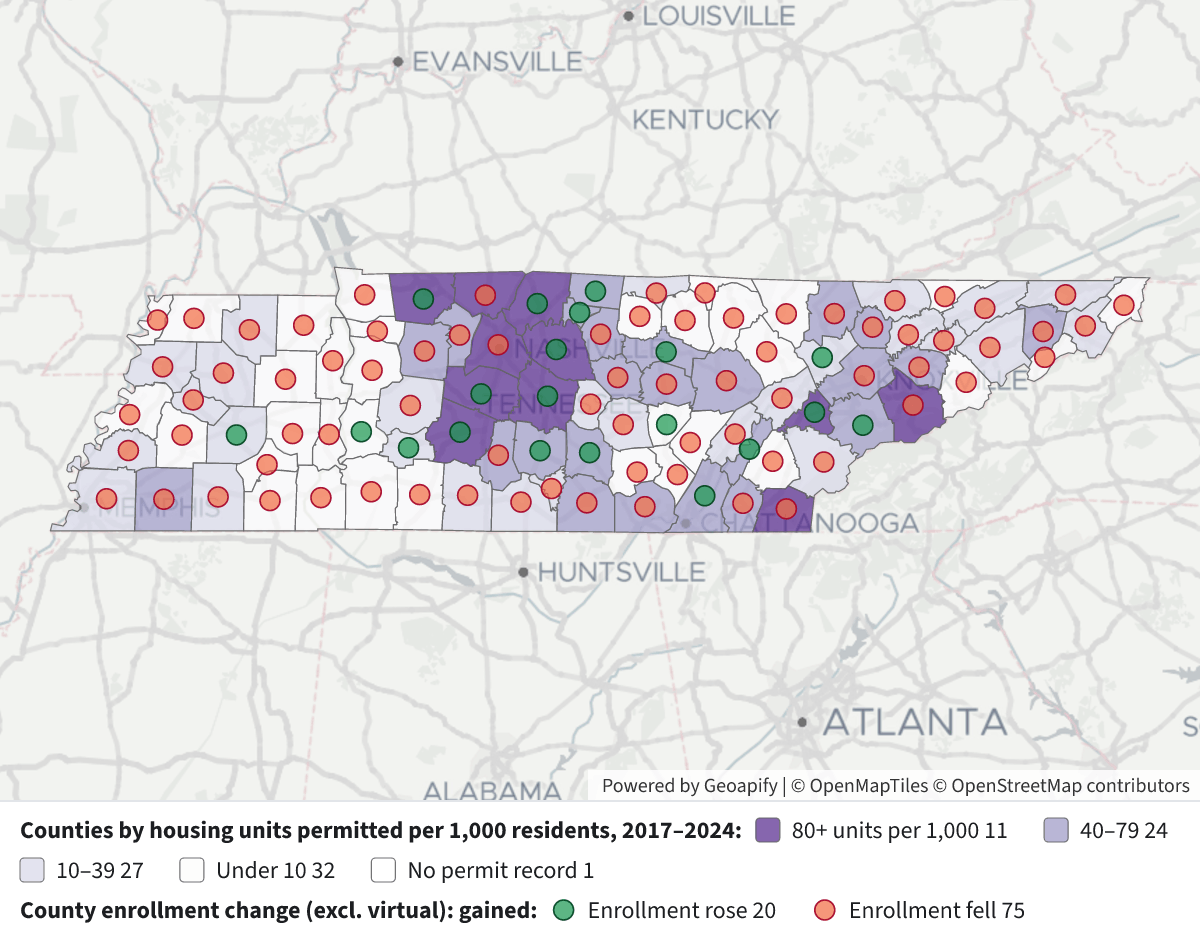
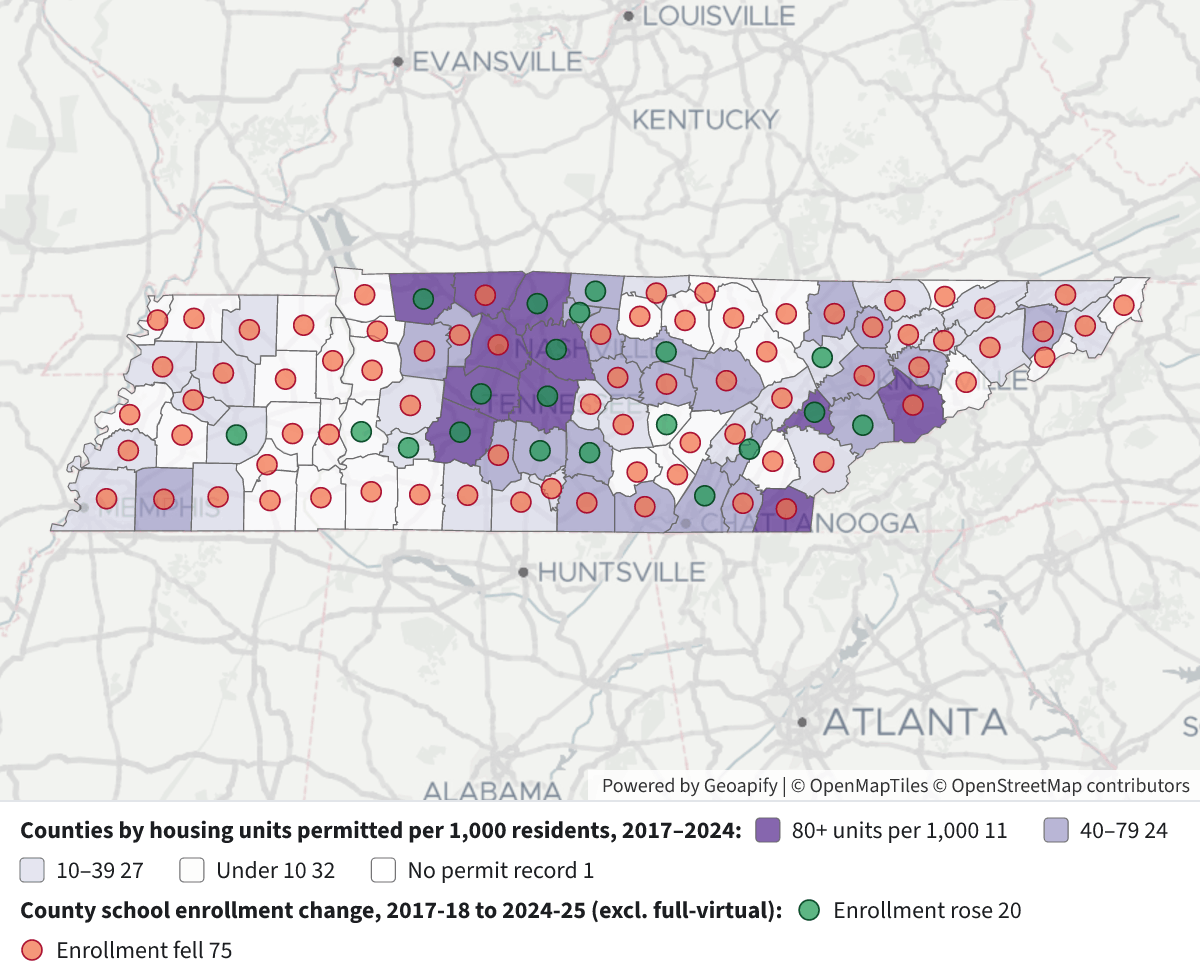
    Mostly yes, but the three largest counties don't fit. I compared each county's school enrollment, counted by where its schools are and leaving out full‑virtual schools, with the housing units permitted there in 2017–2024 (Census Building Permits Survey).

    Housing Permits vs School Enrollment ChangeHousing Permits vs School Enrollment Change⬇ Image

    Map legend:

    • Purple shading: housing units permitted from 2017 to 2024 per 1,000 residents in 2017. The darkest counties permitted 80 or more.
    • Green dots: county enrollment rose.
    • Orange dots: county enrollment fell.

    What the comparison shows:

    • Seven of the 10 counties with the largest enrollment gains are also among the 10 that permitted the most homes: Rutherford (28,300 units), Montgomery (22,900), Williamson (18,400), Hamilton (17,500), Wilson (16,400), Sumner (14,800) and Maury (14,000). Most of these are around Nashville or Clarksville.
    • The other three of the top 10 permitting counties lost students:
      • Davidson permitted the most homes in the state, 86,300 units, yet lost about 700 students (−0.8%).
      • Knox permitted 24,300 units and lost about 1,000 (−1.6%).
      • Shelby permitted 15,000 units and lost about 3,900 (−2.5%).
    • Counties grouped by permits per resident (about 24 counties each):
      • Top quarter: enrollment up 2.9%, with 12 of 24 counties gaining.
      • Second quarter: down 3.4%.
      • Third quarter: down 4.7%.
      • Bottom quarter: down 6.7%, with only one county gaining.
    • Overall the link is moderate. The rank correlation between permits per resident and enrollment change is 0.45. Building a lot of housing is no guarantee of more students: Maury (149 units per 1,000), Sevier (100) and Fayette (76) all permitted heavily, and Sevier and Fayette lost students.

    Caveats:

    • Permits authorize construction; they don't count completed homes, and some permitted units are never built. Pickett County has no permit record in these years.
    • Enrollment is the official fall count. It covers public schools only, so it doesn't capture moves to private school or homeschooling.
    • Districts aren't the same as counties. City districts such as Murfreesboro, Lebanon and the Shelby suburbs are inside their counties' totals.

    I can also compare against 2017–2023 permits to allow for the time between a permit and families moving in, or look only at single‑family units.

Layers

  • …
    • …
    • …
    • …
    • …
    • …
  • …
    • …
    • …

Click anything on the map for its details.

The transcript below the answer shows every query it ran. Shapefiles of every layer, at full detail, can be downloaded in State Planner: sign up to ask your own question and export any map.

Ask your own question about Tennessee

Send takes you to a free sign-up, no card needed, or to sign in if you have an account. Your question will be waiting in your new chat.

Transcript

What follows is the transcript of this chat as State Planner generated it. It is here to show how the answer above was arrived at: every query State Planner ran, what each one returned, and where the data came from.

transcript.md

↑ Contents

State Planner chat · https://stateplanner.com

  • State: Tennessee (TN)
  • Started: October 22, 2026, 12:35 AM UTC
  • Runtime: 1 min 47 sec
  • Status: completed
Prompt

Which Tennessee school districts gained or lost the most students since 2017–18? Map the schools by enrollment change, and say whether the gains are in the counties permitting the most new homes.

Model: Anthropic: Claude Opus 5.5 (anthropic/claude-opus-5.5, via openrouter)

Response

Now a county map setting permits beside enrollment change.


District enrollment change, 2017‑18 to 2024‑25 (NCES Common Core of Data)

Statewide, public school enrollment barely changed: 1,001,967 students in fall 2017 and 1,002,363 in fall 2024. Seven schools in 2017‑18 and 15 in 2024‑25 reported no enrollment and are left out of the totals. Underneath that flat total, students shifted between districts.

Districts with the largest gains

District2017‑182024‑25Change%
Tennessee Public Charter School Commission–6,979+6,979new
Rutherford County45,29252,127+6,835+15.1%
Montgomery County34,84139,385+4,544+13.0%
Johnson County*2,1104,952+2,842+134.7%
Wilson County18,34320,703+2,360+12.9%
Williamson County39,32241,593+2,271+5.8%
Lewis County*1,7253,731+2,006+116.3%
Memphis‑Shelby County Schools109,591111,125+1,534+1.4%
Union County*4,2075,514+1,307+31.1%
Hamilton County44,82245,981+1,159+2.6%

Districts with the largest losses

District2017‑182024‑25Change%
Achievement School District11,4191,412−10,007−87.6%
Davidson County (Metro Nashville)84,72881,022−3,706−4.4%
Sullivan County9,7587,878−1,880−19.3%
Tipton County11,1149,975−1,139−10.2%
Lauderdale County4,1593,277−882−21.2%
Carter County5,2904,450−840−15.9%
Cheatham County6,2775,451−826−13.2%
Greene County6,7836,088−695−10.2%
Hawkins County6,7056,038−667−9.9%
Fayette County3,5602,909−651−18.3%

* Johnson, Lewis and Union counties grew because of full‑virtual schools they host. Tennessee Connections Academy has about 3,000 students in Johnson County, Volunteer State Virtual Academy about 2,000 in Lewis, and Tennessee Virtual Academy and its junior high about 2,700 in Union. Those students live all over the state. Leave the virtual schools out and all three counties are roughly flat or down.

Two of the biggest moves are students changing district rather than arriving or leaving:

  • The Achievement School District's large loss mostly matches the new Charter Commission district and Memphis‑Shelby's gain.
  • Counted by where the schools are, Davidson County lost only about 700 students, not 3,700, because the Charter Commission's schools sit mostly in Nashville.
Schools by enrollment change
School Enrollment Change 2017-18 to 2024-25

Map legend (each school is matched to itself by its NCES school ID):

  • Dark blue: gained 200 or more students (68 schools)
  • Light blue: gained 50–199 (202)
  • Grey: changed by fewer than 50 (804)
  • Orange: lost 50–199 (483)
  • Dark red: lost 200 or more (95)
  • Green: school ID new since 2017‑18 (263 schools, about 82,500 students)
  • Black: school ID not listed in 2024‑25 (124 schools that had about 36,200 students)
  • White: enrollment not reported in one of the two years

A school's ID changes when it moves to another district, as when schools left the Achievement School District, so some green and black dots are the same building under a new operator. Many of the gains among existing schools are in Rutherford, Montgomery, Wilson and Williamson counties. Losses are spread widely across rural counties.

Are the gains where the most homes are being permitted?

Mostly yes, but the three largest counties don't fit. I compared each county's school enrollment, counted by where its schools are and leaving out full‑virtual schools, with the housing units permitted there in 2017–2024 (Census Building Permits Survey).
Housing Permits vs School Enrollment Change

Map legend:

  • Purple shading: housing units permitted from 2017 to 2024 per 1,000 residents in 2017. The darkest counties permitted 80 or more.
  • Green dots: county enrollment rose.
  • Orange dots: county enrollment fell.

What the comparison shows:

  • Seven of the 10 counties with the largest enrollment gains are also among the 10 that permitted the most homes: Rutherford (28,300 units), Montgomery (22,900), Williamson (18,400), Hamilton (17,500), Wilson (16,400), Sumner (14,800) and Maury (14,000). Most of these are around Nashville or Clarksville.
  • The other three of the top 10 permitting counties lost students:
    • Davidson permitted the most homes in the state, 86,300 units, yet lost about 700 students (−0.8%).
    • Knox permitted 24,300 units and lost about 1,000 (−1.6%).
    • Shelby permitted 15,000 units and lost about 3,900 (−2.5%).
  • Counties grouped by permits per resident (about 24 counties each):
    • Top quarter: enrollment up 2.9%, with 12 of 24 counties gaining.
    • Second quarter: down 3.4%.
    • Third quarter: down 4.7%.
    • Bottom quarter: down 6.7%, with only one county gaining.
  • Overall the link is moderate. The rank correlation between permits per resident and enrollment change is 0.45. Building a lot of housing is no guarantee of more students: Maury (149 units per 1,000), Sevier (100) and Fayette (76) all permitted heavily, and Sevier and Fayette lost students.

Caveats:

  • Permits authorize construction; they don't count completed homes, and some permitted units are never built. Pickett County has no permit record in these years.
  • Enrollment is the official fall count. It covers public schools only, so it doesn't capture moves to private school or homeschooling.
  • Districts aren't the same as counties. City districts such as Murfreesboro, Lebanon and the Shelby suburbs are inside their counties' totals.

I can also compare against 2017–2023 permits to allow for the time between a permit and families moving in, or look only at single‑family units.

Exploratory Queries
Query 1 — Check years, school counts and enrollment coverage per year.
   SELECT school_year,
          count(*) n,
          count(enrollment) with_enr,
          sum(enrollment) enr,
          count(DISTINCT leaid) districts
     FROM tn_nces_public_schools
 GROUP BY 1
 ORDER BY 1
school_yearnwith_enrenrdistricts
2017-18178917821001967147
2018-19186218621006309147
2019-20189418781014744147
2020-2119071880984066148
2021-2219311906995549149
2022-23193219001005626148
2023-24192419051003495148
2024-25192819131002363149

data/turn-1-query-1.csv

Query 2 — Check permit years available.
   SELECT min(YEAR),
          max(YEAR),
          count(DISTINCT geoid)
     FROM tn_bps_county_permits
    WHERE YEAR >= 2017
minmaxcount
2017202594

data/turn-1-query-2.csv

Query 3 — Enrollment change by district, 2017-18 to 2024-25.
     WITH a AS (
             SELECT leaid,
                    max(district_name) dn,
                    sum(enrollment) e,
                    count(*) s,
                    count(enrollment) se,
                    mode() WITHIN GROUP (
                     ORDER BY county_name
                    ) cty
               FROM tn_nces_public_schools
              WHERE school_year = '2017-18'
           GROUP BY 1
          ),
          b AS (
             SELECT leaid,
                    max(district_name) dn,
                    sum(enrollment) e,
                    count(*) s,
                    count(enrollment) se,
                    mode() WITHIN GROUP (
                     ORDER BY county_name
                    ) cty
               FROM tn_nces_public_schools
              WHERE school_year = '2024-25'
           GROUP BY 1
          )
   SELECT coalesce(b.leaid, a.leaid) leaid,
          coalesce(b.dn, a.dn) district,
          coalesce(b.cty, a.cty) county,
          a.e e17,
          b.e e24,
          coalesce(b.e, 0) - coalesce(a.e, 0) chg,
          round(100.0 * (b.e - a.e) / nullif(a.e, 0), 1) pct,
          a.s s17,
          b.s s24
     FROM a
FULL JOIN b USING (leaid)
 ORDER BY chg DESC
leaiddistrictcountye17e24chgpcts17s24
4700157Tennessee Public Charter School CommissionDavidson County6979697917
4703690Rutherford CountyRutherford County4529252127683515.14755
4703030Montgomery CountyMontgomery County3484139385454413.03946
4702160Johnson CountyJohnson County211049522842134.778
4704550Wilson CountyWilson County1834320703236012.92125
4704530Williamson CountyWilliamson County393224159322715.84452
4702430Lewis CountyLewis County172537312006116.347
4700148Memphis-Shelby County SchoolsShelby County10959111112515341.4201223
4704290Union CountyUnion County42075514130731.11011
4701590Hamilton CountyHamilton County448224598111592.67882
4704020Sumner CountySumner County296363071910833.74953
4704551University SchoolsShelby County9579573
4700154LakelandShelby County1652253888653.622
4702370LebanonWilson County3773462885522.767
4703240Oak RidgeAnderson County4440507863814.478
4700990DeKalb CountyDeKalb County3041364460319.857
4700149ColliervilleShelby County867192635926.8810
4703150MurfreesboroRutherford County884193425015.71213
4702700MaryvilleBlount County534957173686.978
4703480Putnam CountyPutnam County11421117763553.12022
4702400Lenoir CityLoudon County2297263834114.834
4702760Maury CountyMaury County12791130983072.42124
4700180Bedford CountyBedford County875490422883.31415
4702610ManchesterCoffee County1400162822816.333
4700060AlcoaBlount County2047227022310.944

25 out of 151 are listed here.

data/turn-1-query-3.csv

Query 4 — Check for virtual schools driving big percent gains in small districts.
   SELECT school_year,
          district_name,
          school_name,
          virtual,
          enrollment
     FROM tn_nces_public_schools
    WHERE leaid IN ('4702160', '4702430', '4704290', '4700990')
      AND school_year IN ('2017-18', '2024-25')
      AND (
          virtual ILIKE '%full%'
       OR school_name ILIKE '%virtual%'
       OR school_name ILIKE '%online%'
       OR enrollment > 1000
          )
 ORDER BY 2,
          3,
          1
school_yeardistrict_nameschool_namevirtualenrollment
2024-25DeKalb CountyDeKalb County Schools Adult Education Virtual SchoolFull virtual784
2024-25Johnson CountyTennessee Connections Academy Johnson County 4-8Full virtual1471
2024-25Johnson CountyTennessee Connections Academy Johnson County 9-12Full virtual1543
2024-25Lewis CountyVolunteer State Virtual Academy Elementary SchoolFull virtual614
2024-25Lewis CountyVolunteer State Virtual Academy High SchoolFull virtual943
2024-25Lewis CountyVolunteer State Virtual Academy Middle SchoolFull virtual421
2017-18Union CountyTennessee Virtual AcademyFull virtual1216
2024-25Union CountyTennessee Virtual AcademyFull virtual1867
2024-25Union CountyTennessee Virtual Junior High SchoolFull virtual856

data/turn-1-query-4.csv

Query 5 — County-level school enrollment change (non-virtual) versus housing units permitted 2017-2024.
     WITH e AS (
             SELECT county_fips,
                    sum(enrollment) FILTER (
                        WHERE school_year = '2017-18'
                    ) e17,
                    sum(enrollment) FILTER (
                        WHERE school_year = '2024-25'
                    ) e24
               FROM tn_nces_public_schools
              WHERE school_year IN ('2017-18', '2024-25')
                AND coalesce(virtual, '') <> 'Full virtual'
           GROUP BY 1
          ),
          p AS (
             SELECT geoid,
                    sum(units_total) u
               FROM tn_bps_county_permits
              WHERE YEAR BETWEEN 2017 AND 2024
           GROUP BY 1
          ),
          pop AS (
             SELECT geoid,
                    pop_estimate
               FROM tn_census_county_pop_est
              WHERE YEAR = 2017
          )
   SELECT c.name,
          e.e17,
          e.e24,
          e.e24 - e.e17 chg,
          round(100.0 * (e.e24 - e.e17) / e.e17, 1) pct,
          p.u units,
          round(1000.0 * p.u / pop.pop_estimate, 1) per1k,
          rank() OVER (
           ORDER BY p.u DESC NULLS LAST
          ) units_rank,
          rank() OVER (
           ORDER BY e.e24 - e.e17 DESC
          ) chg_rank
     FROM tn_census_counties c
LEFT JOIN e ON e.county_fips = c.geoid
LEFT JOIN p ON p.geoid = c.geoid
LEFT JOIN pop ON pop.geoid = c.geoid
 ORDER BY units DESC NULLS LAST
namee17e24chgpctunitsper1kunits_rankchg_rank
Davidson County8558384879-704-0.886283122.6187
Rutherford County5413361904777114.42832788.621
Knox County6093759932-1005-1.62433752.3392
Montgomery County3484138634379310.922928111.742
Williamson County430254463716123.71839180.254
Hamilton County44794457279332.11751848.966
Wilson County2206125216315514.316401119.673
Shelby County153052149173-3879-2.51503016.1895
Sumner County296363067110353.51482680.095
Maury County12791130983072.413985149.0109
Sevier County1451214408-104-0.7967599.71133
Blount County1816618195290.2686952.61217
Robertson County1133111201-130-1.1604185.31337
Washington County1638815750-638-3.9600146.21483
Loudon County718477235397.5476390.8157
Putnam County11416117763603.2468161.1168
Bradley County1598415960-24-0.2463944.01723
Sullivan County2084018818-2022-9.7372823.81894
Dickson County83877737-650-7.8349966.21985
Cumberland County74196970-449-6.1349159.32072
Fayette County35602941-619-17.4306775.72182
Bedford County875490422883.3300462.22210
Anderson County1196112027660.6258834.12315
Franklin County58765355-521-8.9255861.12476
Cheatham County62775381-896-14.3245460.72591

25 out of 95 are listed here.

data/turn-1-query-5.csv

Query 6 — Correlation between permits per 1,000 residents and non-virtual enrollment change by county, plus permit-tier summaries.
     WITH e AS (
             SELECT county_fips,
                    sum(enrollment) FILTER (
                        WHERE school_year = '2017-18'
                    ) e17,
                    sum(enrollment) FILTER (
                        WHERE school_year = '2024-25'
                    ) e24
               FROM tn_nces_public_schools
              WHERE school_year IN ('2017-18', '2024-25')
                AND coalesce(virtual, '') <> 'Full virtual'
           GROUP BY 1
          ),
          p AS (
             SELECT geoid,
                    sum(units_total) u
               FROM tn_bps_county_permits
              WHERE YEAR BETWEEN 2017 AND 2024
           GROUP BY 1
          ),
          pop AS (
             SELECT geoid,
                    pop_estimate
               FROM tn_census_county_pop_est
              WHERE YEAR = 2017
          ),
          j AS (
             SELECT c.geoid,
                    e.e17,
                    e.e24,
                    100.0 * (e.e24 - e.e17) / e.e17 pct,
                    coalesce(p.u, 0) u,
                    1000.0 * coalesce(p.u, 0) / pop.pop_estimate per1k
               FROM tn_census_counties c
               JOIN e ON e.county_fips = c.geoid
          LEFT JOIN p ON p.geoid = c.geoid
               JOIN pop ON pop.geoid = c.geoid
          ),
          r AS (
             SELECT *,
                    rank() OVER (
                     ORDER BY per1k
                    ) rp,
                    rank() OVER (
                     ORDER BY pct
                    ) re,
                    ntile(4) OVER (
                     ORDER BY per1k DESC
                    ) q
               FROM j
          )
   SELECT (
             SELECT round(corr(rp, re)::numeric, 2)
               FROM r
          ) spearman,
          (
             SELECT round(corr(per1k, pct)::numeric, 2)
               FROM r
          ) pearson,
          q,
          count(*) n,
          round(min(per1k), 1) min_per1k,
          sum(e24 - e17) chg,
          round(100.0 * sum(e24 - e17) / sum(e17), 1) pct,
          count(*) FILTER (
              WHERE e24 > e17
          ) gaining
     FROM r
 GROUP BY q
 ORDER BY q
spearmanpearsonqnmin_per1kchgpctgaining
0.450.5412451.4131912.912
0.450.5422423.8-7100-3.45
0.450.543246.1-12432-4.72
0.450.544230.0-4274-6.71

data/turn-1-query-6.csv

Query 7 — Count schools in each change category for the legend.
     WITH a AS (
             SELECT ncessch,
                    enrollment e
               FROM tn_nces_public_schools
              WHERE school_year = '2017-18'
          ),
          b AS (
             SELECT ncessch,
                    enrollment e
               FROM tn_nces_public_schools
              WHERE school_year = '2024-25'
          )
   SELECT CASE
                    WHEN a.ncessch IS NULL THEN 'new'
                    WHEN b.ncessch IS NULL THEN 'gone'
                    WHEN a.e IS NULL
                           OR b.e IS NULL THEN 'na'
                              WHEN b.e - a.e <= -200 THEN 'l2'
                              WHEN b.e - a.e <= -50 THEN 'l1'
                              WHEN b.e - a.e < 50 THEN 'z'
                              WHEN b.e - a.e < 200 THEN 'g1'
                              ELSE 'g2'
          END cat,
          count(*),
          sum(coalesce(b.e, 0) - coalesce(a.e, 0)) net
     FROM a
FULL JOIN b USING (ncessch)
 GROUP BY 1
 ORDER BY 1
catcountnet
g120219019
g26821833
gone124-36161
l1483-49501
l295-28844
na13-4882
new26382539
z804-3607

data/turn-1-query-7.csv

Map Layer Queries
School Enrollment Change 2017-18 to 2024-25: Counties
   SELECT geom,
          name AS "County"
     FROM tn_census_counties

Picture: maps/turn-1-school-enrollment-change.png

School Enrollment Change 2017-18 to 2024-25: Schools by enrollment change — colored by "cat": Lost 200+ students (#b2182b), Lost 50–199 (#ef8a62), Within ±49 (#e0e0e0), Gained 50–199 (#67a9cf), Gained 200+ (#2166ac), New school ID since 2017-18 (#1b9e77), School ID not listed in 2024-25 (#000000), Enrollment not reported (#ffffff)
     WITH a AS (
             SELECT ncessch,
                    enrollment e,
                    school_name,
                    district_name,
                    geom
               FROM tn_nces_public_schools
              WHERE school_year = '2017-18'
          ),
          b AS (
             SELECT ncessch,
                    enrollment e,
                    school_name,
                    district_name,
                    virtual,
                    geom
               FROM tn_nces_public_schools
              WHERE school_year = '2024-25'
          )
   SELECT coalesce(b.geom, a.geom) geom,
          coalesce(b.school_name, a.school_name) AS "School",
          coalesce(b.district_name, a.district_name) AS "District",
          a.e AS "Enrollment 2017-18",
          b.e AS "Enrollment 2024-25",
          b.e - a.e AS "Change",
          b.virtual AS "Virtual",
          CASE
                    WHEN a.ncessch IS NULL THEN 'new'
                    WHEN b.ncessch IS NULL THEN 'gone'
                    WHEN a.e IS NULL
                           OR b.e IS NULL THEN 'na'
                              WHEN b.e - a.e <= -200 THEN 'l2'
                              WHEN b.e - a.e <= -50 THEN 'l1'
                              WHEN b.e - a.e < 50 THEN 'z'
                              WHEN b.e - a.e < 200 THEN 'g1'
                              ELSE 'g2'
          END AS cat
     FROM a
FULL JOIN b USING (ncessch)

Picture: maps/turn-1-school-enrollment-change.png

Housing Permits vs School Enrollment Change: Counties by housing units permitted per 1,000 residents, 2017–2024 — colored by "tier": 80+ units per 1,000 (#54278f), 40–79 (#9e9ac8), 10–39 (#dadaeb), Under 10 (#fcfbfd), No permit record (#ffffff)
     WITH e AS (
             SELECT county_fips,
                    sum(enrollment) FILTER (
                        WHERE school_year = '2017-18'
                    ) e17,
                    sum(enrollment) FILTER (
                        WHERE school_year = '2024-25'
                    ) e24
               FROM tn_nces_public_schools
              WHERE school_year IN ('2017-18', '2024-25')
                AND coalesce(virtual, '') <> 'Full virtual'
           GROUP BY 1
          ),
          p AS (
             SELECT geoid,
                    sum(units_total) u
               FROM tn_bps_county_permits
              WHERE YEAR BETWEEN 2017 AND 2024
           GROUP BY 1
          ),
          pop AS (
             SELECT geoid,
                    pop_estimate
               FROM tn_census_county_pop_est
              WHERE YEAR = 2017
          )
   SELECT c.geom,
          c.name AS "County",
          p.u AS "Housing units permitted 2017-2024",
          round(1000.0 * p.u / pop.pop_estimate, 1) AS "Units per 1,000 residents(2017 pop)",
          e.e17 AS "Enrollment 2017-18 (excl. virtual)",
          e.e24 AS "Enrollment 2024-25 (excl. virtual)",
          e.e24 - e.e17 AS "Enrollment change",
          round(100.0 * (e.e24 - e.e17) / e.e17, 1) AS "Enrollment change %",
          CASE
                    WHEN p.u IS NULL THEN 'q0'
                    WHEN 1000.0 * p.u / pop.pop_estimate >= 80 THEN 'q4'
                    WHEN 1000.0 * p.u / pop.pop_estimate >= 40 THEN 'q3'
                    WHEN 1000.0 * p.u / pop.pop_estimate >= 10 THEN 'q2'
                    ELSE 'q1'
          END AS tier
     FROM tn_census_counties c
LEFT JOIN e ON e.county_fips = c.geoid
LEFT JOIN p ON p.geoid = c.geoid
LEFT JOIN pop ON pop.geoid = c.geoid

Picture: maps/turn-1-permits-vs-enrollment.png

Housing Permits vs School Enrollment Change: County enrollment change (excl. virtual): gained — colored by "dir": Enrollment rose (#1a9850), Enrollment fell (#f46d43)
     WITH e AS (
             SELECT county_fips,
                    sum(enrollment) FILTER (
                        WHERE school_year = '2017-18'
                    ) e17,
                    sum(enrollment) FILTER (
                        WHERE school_year = '2024-25'
                    ) e24
               FROM tn_nces_public_schools
              WHERE school_year IN ('2017-18', '2024-25')
                AND coalesce(virtual, '') <> 'Full virtual'
           GROUP BY 1
          )
   SELECT ST_PointOnSurface(c.geom) geom,
          c.name AS "County",
          e.e24 - e.e17 AS "Enrollment change",
          round(100.0 * (e.e24 - e.e17) / e.e17, 1) AS "Change %",
          CASE
                    WHEN e.e24 > e.e17 THEN 'up'
                    ELSE 'down'
          END dir
     FROM tn_census_counties c
     JOIN e ON e.county_fips = c.geoid

Picture: maps/turn-1-permits-vs-enrollment.png

Housing Permits vs School Enrollment Change: Counties by housing units permitted per 1,000 residents, 2017–2024 — colored by "tier": 80+ units per 1,000 (#54278f), 40–79 (#9e9ac8), 10–39 (#dadaeb), Under 10 (#fcfbfd), No permit record (#ffffff)
     WITH e AS (
             SELECT county_fips,
                    sum(enrollment) FILTER (
                        WHERE school_year = '2017-18'
                    ) e17,
                    sum(enrollment) FILTER (
                        WHERE school_year = '2024-25'
                    ) e24
               FROM tn_nces_public_schools
              WHERE school_year IN ('2017-18', '2024-25')
                AND coalesce(virtual, '') <> 'Full virtual'
           GROUP BY 1
          ),
          p AS (
             SELECT geoid,
                    sum(units_total) u
               FROM tn_bps_county_permits
              WHERE YEAR BETWEEN 2017 AND 2024
           GROUP BY 1
          ),
          pop AS (
             SELECT geoid,
                    pop_estimate
               FROM tn_census_county_pop_est
              WHERE YEAR = 2017
          )
   SELECT c.geom,
          c.name AS "County",
          p.u AS "Housing units permitted 2017-2024",
          round(1000.0 * p.u / pop.pop_estimate, 1) AS "Units per 1,000 residents(2017 pop)",
          e.e17 AS "Enrollment 2017-18 (excl. virtual)",
          e.e24 AS "Enrollment 2024-25 (excl. virtual)",
          e.e24 - e.e17 AS "Enrollment change",
          round(100.0 * (e.e24 - e.e17) / e.e17, 1) AS "Enrollment change %",
          CASE
                    WHEN p.u IS NULL THEN 'q0'
                    WHEN 1000.0 * p.u / pop.pop_estimate >= 80 THEN 'q4'
                    WHEN 1000.0 * p.u / pop.pop_estimate >= 40 THEN 'q3'
                    WHEN 1000.0 * p.u / pop.pop_estimate >= 10 THEN 'q2'
                    ELSE 'q1'
          END AS tier
     FROM tn_census_counties c
LEFT JOIN e ON e.county_fips = c.geoid
LEFT JOIN p ON p.geoid = c.geoid
LEFT JOIN pop ON pop.geoid = c.geoid

Picture: maps/turn-1-permits-vs-enrollment-2.png

Housing Permits vs School Enrollment Change: County school enrollment change, 2017-18 to 2024-25 (excl. full-virtual) — colored by "dir": Enrollment rose (#1a9850), Enrollment fell (#f46d43)
     WITH e AS (
             SELECT county_fips,
                    sum(enrollment) FILTER (
                        WHERE school_year = '2017-18'
                    ) e17,
                    sum(enrollment) FILTER (
                        WHERE school_year = '2024-25'
                    ) e24
               FROM tn_nces_public_schools
              WHERE school_year IN ('2017-18', '2024-25')
                AND coalesce(virtual, '') <> 'Full virtual'
           GROUP BY 1
          )
   SELECT ST_PointOnSurface(c.geom) geom,
          c.name AS "County",
          e.e24 - e.e17 AS "Enrollment change",
          round(100.0 * (e.e24 - e.e17) / e.e17, 1) AS "Change %",
          CASE
                    WHEN e.e24 > e.e17 THEN 'up'
                    ELSE 'down'
          END dir
     FROM tn_census_counties c
     JOIN e ON e.county_fips = c.geoid

Picture: maps/turn-1-permits-vs-enrollment-2.png

Used Data Sets

data/turn-1-query-1.csv

↑ Contents
school_yearnwith_enrenrdistricts
2017-18178917821001967147
2018-19186218621006309147
2019-20189418781014744147
2020-2119071880984066148
2021-2219311906995549149
2022-23193219001005626148
2023-24192419051003495148
2024-25192819131002363149

8 rows.

data/turn-1-query-2.csv

↑ Contents
minmaxcount
2017202594

1 row.

data/turn-1-query-3.csv

↑ Contents
leaiddistrictcountye17e24chgpcts17s24
4700157Tennessee Public Charter School CommissionDavidson County6979697917
4703690Rutherford CountyRutherford County4529252127683515.14755
4703030Montgomery CountyMontgomery County3484139385454413.03946
4702160Johnson CountyJohnson County211049522842134.778
4704550Wilson CountyWilson County1834320703236012.92125
4704530Williamson CountyWilliamson County393224159322715.84452
4702430Lewis CountyLewis County172537312006116.347
4700148Memphis-Shelby County SchoolsShelby County10959111112515341.4201223
4704290Union CountyUnion County42075514130731.11011
4701590Hamilton CountyHamilton County448224598111592.67882
4704020Sumner CountySumner County296363071910833.74953
4704551University SchoolsShelby County9579573
4700154LakelandShelby County1652253888653.622
4702370LebanonWilson County3773462885522.767
4703240Oak RidgeAnderson County4440507863814.478
4700990DeKalb CountyDeKalb County3041364460319.857
4700149ColliervilleShelby County867192635926.8810
4703150MurfreesboroRutherford County884193425015.71213
4702700MaryvilleBlount County534957173686.978
4703480Putnam CountyPutnam County11421117763553.12022
4702400Lenoir CityLoudon County2297263834114.834
4702760Maury CountyMaury County12791130983072.42124
4700180Bedford CountyBedford County875490422883.31415
4702610ManchesterCoffee County1400162822816.333
4700060AlcoaBlount County2047227022310.944
4702550Macon CountyMacon County400742162095.288
4702520Loudon CountyLoudon County488750851984.199
4702580Madison CountyMadison County12836130171811.42326
4704170Trousdale CountyTrousdale County1255141115612.433
4701500GreenevilleGreene County284629771314.678
4703300OneidaScott County128414011179.133
4701110ElizabethtonCarter County256626781124.455
4700690ClevelandBradley County57925890981.799
4702010Huntingdon Special School DistrictCarroll County12701364947.434
4704200TullahomaCoffee County35463632862.478
4701390BradfordGibson County5556307513.522
4702910Meigs CountyMeigs County17521797452.644
4702460LexingtonHenderson County851893424.922
4702490Lincoln CountyLincoln County38633899360.988
4700156Department Of Children's Services Education DivisionFayette County32321
4703390Perry CountyPerry County10751100252.345
4702190KingsportSullivan County76377658210.31212
4704320Van Buren CountyVan Buren County739756172.322
4703210NewportCocke County713730172.411
4704100TrentonGibson County13611372110.834
4700330Bradley CountyBradley County1019210202100.11718
4700930DaytonRhea County88489170.811
4700120AthensMcMinn County1744174840.253
Shelby County07
4703060Moore CountyMoore County885882-3-0.322
4700146Tennessee Schools for the DeafKnox County135131-4-3.034
4700480Carroll CountyCarroll County61-5-83.311
4700143West Tennessee School for the DeafMadison County4233-9-21.411
4700720ClintonAnderson County973963-10-1.033
4700240Benton CountyBenton County21602150-10-0.568
4704050SweetwaterMonroe County15421532-10-0.644
4700030AlamoCrockett County611600-11-1.811
4704260Union CityObion County16581647-11-0.733
4700210BellsCrockett County419407-12-2.911
4701230Fentress CountyFentress County22452229-16-0.756
4703900South CarrollCarroll County361343-18-5.011
4702970MilanGibson County20472026-21-1.034
4703660RogersvilleHawkins County672644-28-4.211
4701890Hollow Rock - BrucetonCarroll County655626-29-4.422
4700145Tennessee School for BlindDavidson County131100-31-23.711
4700150Millington Municipal SchoolsShelby County26322587-45-1.743
4700144Alvin C. York Agricultural InstituteFentress County538493-45-8.411
4701620Hancock CountyHancock County959903-56-5.824
4702790McKenzieCarroll County13561296-60-4.433
4700151GermantownShelby County61136053-60-1.057
4703420Pickett CountyPickett County670605-65-9.722
4700660Clay CountyClay County11211054-67-6.034
4703870Smith CountySmith County31263056-70-2.299
4702280Lake CountyLake County817743-74-9.133
4701080DyersburgDyer County26632585-78-2.944
4701140EtowahMcMinn County411332-79-19.211
4702340Lawrence CountyLawrence County69476867-80-1.21215
4700600Chester CountyChester County28852801-84-2.966
4703540Richard CityMarion County272183-89-32.711
4701800Henderson CountyHenderson County39913900-91-2.3910
4700360BristolSullivan County41364044-92-2.289
4703960Stewart CountyStewart County20641972-92-4.546
4700850Crockett CountyCrockett County20641969-95-4.655
4702070Jackson CountyJackson County14931389-104-7.044
4703780Sevier CountySevier County1451214408-104-0.72833
4702130Johnson CityWashington County79257818-107-1.41112
4701830Henry CountyHenry County30342924-110-3.666
4703600Robertson CountyRobertson County1138111267-114-1.02123
4701920Houston CountyHouston County13831265-118-8.546
4701950Humboldt City SchoolsGibson County11791044-135-11.533
4703360ParisHenry County16861538-148-8.833
4700450Cannon CountyCannon County19671813-154-7.875
4700155Tennessee State Board of EducationShelby County156-1561
4700780Coffee CountyCoffee County44744313-161-3.6911
4704490West Carroll Sp DistCarroll County910734-176-19.333
4700960Decatur CountyDecatur County16721492-180-10.846
4703090Morgan CountyMorgan County29802800-180-6.088
4700152ArlingtonShelby County45994403-196-4.344
4701400Gibson Co Sp DistGibson County40243828-196-4.999
4704470Weakley CountyWeakley County41933993-200-4.81011
4703330Overton CountyOverton County31322924-208-6.678
4700270Bledsoe CountyBledsoe County17801570-210-11.855
4702670Marshall CountyMarshall County55425322-220-4.01010
4703450Polk CountyPolk County23902160-230-9.667
4704440Wayne CountyWayne County23162079-237-10.279
4700001Hamblen CountyHamblen County1054310300-243-2.31818
4703000Monroe CountyMonroe County52575006-251-4.81213
4702640Marion CountyMarion County41053844-261-6.41112
4704500White CountyWhite County39973736-261-6.598
4701410Giles CountyGiles County38613595-266-6.988
4700630Claiborne CountyClaiborne County42353967-268-6.31214
4704350Warren CountyWarren County65206241-279-4.31112
4700153BartlettShelby County91348834-300-3.31010
4703750Sequatchie CountySequatchie County22301924-306-13.733
4701680Hardin CountyHardin County36193294-325-9.077
4704230Unicoi CountyUnicoi County24052074-331-13.867
4700750Cocke CountyCocke County45354202-333-7.31112
4701980Humphreys CountyHumphreys County29802641-339-11.476
4701530Grundy CountyGrundy County20591711-348-16.975
4702100Jefferson CountyJefferson County73026937-365-5.01114
4701050Dyer CountyDyer County39743600-374-9.488
4703270Obion CountyObion County33482959-389-11.677
4701860Hickman CountyHickman County33923001-391-11.589
4701200FayettevilleLincoln County14761080-396-26.833
4703510Rhea CountyRhea County43073890-417-9.777
4700900Cumberland CountyCumberland County74196970-449-6.11212
4703590Roane CountyRoane County66336178-455-6.91718
4701290Franklin CountyFranklin County54284972-456-8.41111
4701770Haywood CountyHaywood County29042422-482-16.657
4700300Blount CountyBlount County1077010270-500-4.62022
4704380Washington CountyWashington County84797969-510-6.01615
4700420Campbell CountyCampbell County56385118-520-9.21216
4701440Grainger CountyGrainger County35032975-528-15.189
4701650Hardeman County SchoolsHardeman County36873157-530-14.499
4700090Anderson CountyAnderson County65486018-530-8.11619
4702880McNairy CountyMcNairy County42713733-538-12.6810
4701260Franklin SSDWilliamson County37033161-542-14.688
4703720Scott CountyScott County29772423-554-18.677
4701020Dickson CountyDickson County83877777-610-7.31617
4702220Knox CountyKnox County6080260185-617-1.08795
4702820McMinn CountyMcMinn County56905051-639-11.299
4701170Fayette County Public SchoolsFayette County35602909-651-18.377
4701740Hawkins CountyHawkins County67056038-667-9.91818
4701470Greene CountyGreene County67836088-695-10.21618
4700570Cheatham CountyCheatham County62775451-826-13.21314
4700510Carter CountyCarter County52904450-840-15.91515
4702310Lauderdale CountyLauderdale County41593277-882-21.277
4704080Tipton CountyTipton County111149975-1139-10.21414
4703990Sullivan CountySullivan County97587878-1880-19.32217
4703180Davidson CountyDavidson County8472881022-3706-4.4161162
4700147Achievement School DistrictShelby County114191412-10007-87.63212

151 rows.

data/turn-1-query-4.csv

↑ Contents
school_yeardistrict_nameschool_namevirtualenrollment
2024-25DeKalb CountyDeKalb County Schools Adult Education Virtual SchoolFull virtual784
2024-25Johnson CountyTennessee Connections Academy Johnson County 4-8Full virtual1471
2024-25Johnson CountyTennessee Connections Academy Johnson County 9-12Full virtual1543
2024-25Lewis CountyVolunteer State Virtual Academy Elementary SchoolFull virtual614
2024-25Lewis CountyVolunteer State Virtual Academy High SchoolFull virtual943
2024-25Lewis CountyVolunteer State Virtual Academy Middle SchoolFull virtual421
2017-18Union CountyTennessee Virtual AcademyFull virtual1216
2024-25Union CountyTennessee Virtual AcademyFull virtual1867
2024-25Union CountyTennessee Virtual Junior High SchoolFull virtual856

9 rows.

data/turn-1-query-5.csv

↑ Contents
namee17e24chgpctunitsper1kunits_rankchg_rank
Davidson County8558384879-704-0.886283122.6187
Rutherford County5413361904777114.42832788.621
Knox County6093759932-1005-1.62433752.3392
Montgomery County3484138634379310.922928111.742
Williamson County430254463716123.71839180.254
Hamilton County44794457279332.11751848.966
Wilson County2206125216315514.316401119.673
Shelby County153052149173-3879-2.51503016.1895
Sumner County296363067110353.51482680.095
Maury County12791130983072.413985149.0109
Sevier County1451214408-104-0.7967599.71133
Blount County1816618195290.2686952.61217
Robertson County1133111201-130-1.1604185.31337
Washington County1638815750-638-3.9600146.21483
Loudon County718477235397.5476390.8157
Putnam County11416117763603.2468161.1168
Bradley County1598415960-24-0.2463944.01723
Sullivan County2084018818-2022-9.7372823.81894
Dickson County83877737-650-7.8349966.21985
Cumberland County74196970-449-6.1349159.32072
Fayette County35602941-619-17.4306775.72182
Bedford County875490422883.3300462.22210
Anderson County1196112027660.6258834.12315
Franklin County58765355-521-8.9255861.12476
Cheatham County62775381-896-14.3245460.72591
Jefferson County73026882-420-5.8240445.02670
Coffee County89729068961.1233742.22714
Hamblen County1054310300-243-2.3217234.12852
Madison County12878130501721.3214621.92912
Campbell County56385118-520-9.2187047.53075
Marshall County55425322-220-4.0186957.23149
Greene County96298952-677-7.0174925.23286
Polk County23902160-230-9.6165895.83350
Tipton County111149975-1139-10.2160626.53493
Warren County65206241-279-4.3157139.03557
Marion County43663995-371-8.5147251.93665
White County39973736-261-6.5136351.33753
Monroe County67996265-534-7.9127628.13880
Carter County78567005-851-10.8123421.93989
Macon County400742162095.2119949.54011
Gibson County91668900-266-2.9117223.44154
Hawkins County78447196-648-8.3117020.74284
Rhea County51914781-410-7.9111634.54369
Roane County66336100-533-8.0103719.64479
Giles County38613595-266-6.998933.04554
DeKalb County30412860-181-6.097350.34641
Union County29912791-200-6.786845.34744
Trousdale County1255141115612.485778.04813
Smith County31263056-70-2.285643.94928
Hickman County33923001-391-11.583133.85066
Claiborne County42353967-268-6.371622.65156
Meigs County17521797452.663051.45216
Dyer County66376185-452-6.853214.35373
Grainger County35032975-528-15.151522.35477
Weakley County41933993-200-4.846814.25544
McMinn County78457131-714-9.13917.55688
Lincoln County53394938-401-7.538411.15768
Cannon County19671813-154-7.836826.45838
Lewis County17251753281.633027.15918
Hardeman County36873157-530-14.428611.06078
Crockett County30942976-118-3.823616.66135
Moore County885882-3-0.321132.96221
Lauderdale County41593277-882-21.22098.16390
Obion County50064606-400-8.01916.26467
Humphreys County29802641-339-11.41819.66563
Clay County11211054-67-6.018023.66627
Hardin County36193294-325-9.01706.46761
Chester County28852801-84-2.91639.56830
Henry County47204399-321-6.81584.96960
Haywood County29042397-507-17.51518.37074
Henderson County48424744-98-2.01495.47132
Lawrence County69476748-199-2.91333.17243
Unicoi County24052074-331-13.81106.17362
McNairy County42713700-571-13.41094.27481
Sequatchie County22301924-306-13.71087.17558
Overton County31322924-208-6.6984.57646
Benton County21602150-10-0.5966.17722
Perry County10751100252.3779.57819
Grundy County20591711-348-16.9624.67964
Carroll County45584364-194-4.3622.27942
Stewart County20641972-92-4.5564.28131
Scott County42613824-437-10.3502.38271
Cocke County52484932-316-6.0290.88359
Van Buren County739756172.3274.68420
Lake County817743-74-9.1263.58529
Decatur County16721459-213-12.7252.28648
Johnson County21101938-172-8.2231.38739
Houston County13831258-125-9.070.98836
Fentress County27832722-61-2.270.48825
Wayne County23162079-237-10.230.29051
Hancock County959903-56-5.820.39124
Morgan County29802800-180-6.000.09240
Jackson County14931389-104-7.000.09233
Bledsoe County17801570-210-11.800.09247
Pickett County670605-65-9.79526

95 rows.

data/turn-1-query-6.csv

↑ Contents
spearmanpearsonqnmin_per1kchgpctgaining
0.450.5412451.4131912.912
0.450.5422423.8-7100-3.45
0.450.543246.1-12432-4.72
0.450.544230.0-4274-6.71

4 rows.

data/turn-1-query-7.csv

↑ Contents
catcountnet
g120219019
g26821833
gone124-36161
l1483-49501
l295-28844
na13-4882
new26382539
z804-3607

8 rows.

provenance/tn_bps_county_permits.md

↑ Contents

Provenance: tn_bps_county_permits

This file describes how the rows in PostgreSQL table tn_bps_county_permits were obtained from an external source: where they were fetched and how fields were renamed and typed. Field meanings are in the mapping table below.

Identity
  • Table: tn_bps_county_permits
  • Family: BPS
  • Display name: Building Permits by County
  • Source URL: https://www2.census.gov/econ/bps/County/ (co<year>a.txt, 1990 on)
  • Geometry (source / stored): none / none
  • Update cycle: Yearly (each May)
Pipeline

The Building Permits Survey publishes one national county file per year, the annual summary (a), comma-delimited text with a two-row header. Every year from 1990 is loaded; the newest year is the one before the current, once the Bureau has published it. Each year's file is downloaded whole and kept; the sync keeps Tennessee's rows (FIPS State 47) and checks each file's survey date names its year (2024, or 9099 in the 1990s files).

A county listed twice in one year (the 2014 and 2015 files repeat four Alaska boroughs and one Maryland county under a second name with the same estimates) keeps the row with more reported units; two rows with different estimates fail the sync. The monthly and year-to-date files are not loaded.

Changed from the source: cut to Tennessee; reshaped to one row per county per year; the three totals added; the region, division and survey-date columns dropped (doc/BPS-SYNC.md).

No licence terms: a work of the U.S. Government, credited to the U.S. Census Bureau (doc/DATA-LICENSES.md).

Field → column mapping
Source fieldColumnTypeDescription
FIPS State, FIPS CountygeoidtextTwo digits and three, joined
County NamenametextTrailing spaces trimmed
Survey Dateyeartext → integerChecked against the file's year
1-unit Bldgs, Units, Valuebldgs_1, units_1, value_1integerEstimates with imputation
2-units Bldgs, Units, Valuebldgs_2, units_2, value_2integer
3-4 units Bldgs, Units, Valuebldgs_3_4, units_3_4, value_3_4integer
5+ units Bldgs, Units, Valuebldgs_5plus, units_5plus, value_5plusinteger
1-unit rep … 5+ units reprep_bldgs_1 … rep_value_5plusintegerReported only
(computed)bldgs_total, units_total, value_totalThe four estimate sizes added
Region Code, Division Code(dropped)

provenance/tn_census_counties.md

↑ Contents

Provenance: tn_census_counties

This file describes how the rows in PostgreSQL table tn_census_counties were obtained from an external source: where they were fetched and how fields were renamed and typed. Field meanings are in the mapping table below.

Identity
Pipeline

Two Census Bureau sources, joined on the county's 5-digit FIPS code:

  • Boundaries: TIGERweb tigerWMS_Current layer 82 ("Counties"), where=STATE='47', GeoJSON, outSR=4326, keyset-paged on GEOID.
  • CFS areas: sheet CFSAreas of the 2022 Commodity Flow Survey county list, the Tennessee rows (ST = 47). Only the 2022 columns are kept.

The two must name the same counties, or the sync fails. FAF's tn_faf_county_xwalk is built from this table: each county's cfs_geoid is the CFS22_ID of one FAF6 zone.

Field → column mapping
Source fieldColumnTypeDescription
TIGER GEOIDgeoidvarchar(5)state + county FIPS
TIGER GEOID, last 3county_fipsvarchar(3)county FIPS
TIGER NAMEnamevarchar(60)e.g. Shelby County
CFS CFS22_AREAcfs_areavarchar(5)CSA/MSA code, or 99999
CFS CFS22_TYPEcfs_area_typevarchar(1)C, M or R
CFS CFS22_NAME, whitespace collapsedcfs_area_namevarchar(120)the workbook pads some names with doubled and trailing spaces
CFS CFS22_GEOIDcfs_geoidvarchar(19)e.g. E330000US4736800000
TIGER AREALANDaland_m2bigintsquare meters
TIGER AREAWATERawater_m2bigintsquare meters
TIGER INTPTLATintptlatdouble precisioninternal point
TIGER INTPTLONintptlondouble precisioninternal point
geometrygeomgeometry(MultiPolygon, 4326)ST_Multi(ST_GeomFromGeoJSON)
Geometry
  • SRID 4326 (WGS84). GIST index on geom.
Change detection

The Census sync's check compares the layer's vintage ("January 1, 2026 vintage") and Tennessee's row count, and the county list's Last-Modified and length. A change to either marks Census stale, and the next Census sync rebuilds this table, then FAF's crosswalk.

Attribution

US Census Bureau. TIGER products are free to use with acknowledgement of the U.S. Census Bureau as the source; the CFS county list states no terms.

provenance/tn_census_county_pop_est.md

↑ Contents

Provenance: tn_census_county_pop_est

This file describes how the rows in PostgreSQL table tn_census_county_pop_est were obtained from an external source: where they were fetched and how fields were renamed and typed. Field meanings are in the mapping table below.

Identity
  • Table: tn_census_county_pop_est
  • Family: Census
  • Display name: Annual Population Estimates by County
  • Source URL: https://www2.census.gov/programs-surveys/popest/datasets/2020-2025/counties/totals/co-est2025-alldata.csv (vintage 2025; each vintage <V> is 2020-<V>/counties/totals/co-est<V>-alldata.csv), for 2020 on
  • History (2000–2019): under the same datasets/ directory, 2000-2010/intercensal/county/co-est00int-tot.csv and 2010-2020/intercensal/county/asrh/cc-est2020int-agesex-all.csv (the revised population), 2010/2010-eval-estimates/co-est2010-alldata.csv and 2010-2020/counties/totals/co-est2020-alldata.csv (the components of change of the releases they revised)
  • History (1970–1999): under https://www2.census.gov/programs-surveys/popest/tables/, 1900-1980/counties/asrh/co-asr-7079.csv, 1980-1990/counties/asrh/pe-02-<year>.csv and 1990-2000/intercensal/st-co/stch-icen<year>.txt (the county age, sex and race estimates), and 1900-1980/counties/totals/e7079co.txt and 1980-1990/counties/totals/e8089co.txt (the decades' county totals tables, for their census counts)
  • Geometry (source / stored): none / none
  • Update cycle: Yearly (each March)
Pipeline

The Population Estimates Program's national county file, CSV, one row per county with a column per year for each figure. The sync keeps Tennessee's county rows (SUMLEV 050, STATE 47), dropping the state's own total (040), and turns each into one row per year, the years read off the file's POPESTIMATE<year> columns. Every county the file names must be one the county layer of TIGERweb draws, or the sync fails. A file that is not valid UTF-8 is read as Latin-1. These rows are series postcensal.

The years before 2020 are series intercensal, from four further national files that never change:

  • Population, 2000–2009: co-est00int-tot.csv, one row per county, codes written without leading zeros (SUMLEV "50", STATE "1"), which the sync pads. ESTIMATESBASE2000 and POPESTIMATE2000–2009; its POPESTIMATE2010 and CENSUS2010POP are not loaded. vintage 2010.
  • Population, 2010–2019: the Bureau's table of revised county totals for the decade is a spreadsheet that names counties without codes, so the sync reads the same figures from cc-est2020int-agesex-all.csv, one row per county and YEAR code, its POPESTIMATE the whole population: YEAR 1 is the April 1, 2010 base, 2–11 July 1, 2010–2019, and 12 (the April 1, 2020 census) is not loaded. vintage 2020. 2010 is taken from this file, not the 2000s one, which has its own figure for it.
  • Components: the original releases' files, as published, matched by county code: co-est2010-alldata.csv for 2000–2010 (2000 is April to June) and co-est2020-alldata.csv for 2011–2019. Their natural change column is NATURALINC<year>. A county with no row in the 2000s release (one coded anew in the 2010s) has empty 2010 components; any other missing county fails the sync.
  • pop_change is computed, not read: pop_estimate less the row before's (2010's less the 2000s file's 2009, 2000's less 1999's, or ESTIMATESBASE2000 for a county with no 1999 row). The releases' NPOPCHG_<year> describes their own population, not the revised one, and is not loaded.
  • 1970–1999: each county's July 1 population is the sum of its age, sex and race estimates, which tn_census_county_pop_char loads from the same files (its provenance has their layouts): vintage 1980, 1990 and 2000 for the three decades. The Bureau's county totals tables for the 1970s and 1980s, e7079co.txt and e8089co.txt, are fixed-width text in blocks of five years, a long name wrapping onto a line of its own; only their first column, the decade's April 1 census, is loaded, into estimates_base on the 1970 and 1980 rows. Their July figures are not loaded: the 1970s table rounds counties to hundreds, and both are on the geography of their day as the age files are, but not always the same day's. No component of change is loaded before 2000. pop_change is computed as for the later decades, 1970's from the April 1970 count, and the 2000 row's is from July 1999.
  • A history row's county need not be one TIGER draws today (Connecticut's eight old counties, the 1970s' Alaskan census divisions and Virginia's Nansemond, and a handful elsewhere); the sync logs them.
Field → column mapping
Source fieldColumnTypeDescription
STATE + COUNTYgeoidvarchar(5)county FIPS
the <year> suffixyearsmallint
the newest <year>vintagesmallint1980, 1990, 2000, 2010 or 2020 on history rows
seriesvarchar(12)postcensal, or intercensal on history rows
POPESTIMATE<year>pop_estimateinteger
ESTIMATESBASE2020estimates_baseinteger2020 row only (ESTIMATESBASE2000, YEAR 1 on the 2000 and 2010 rows; the decade tables' census column on the 1970 and 1980 rows)
NPOPCHG<year>pop_changeintegercomputed on history rows
BIRTHS<year>birthsinteger
DEATHS<year>deathsinteger
NATURALCHG<year>natural_changeintegerNATURALINC<year> on history rows
INTERNATIONALMIG<year>international_miginteger
DOMESTICMIG<year>domestic_miginteger
NETMIG<year>net_miginteger
RESIDUAL<year>residualinteger
GQESTIMATES<year>gq_estimateinteger

The file's per-1,000 rate columns (R…) and GQESTIMATESBASE2020 are not loaded.

Geometry
  • No geometry column.
Change detection

The Census sync's check asks for the next vintage's file each time and moves to it once it is published; otherwise it compares the current file's Last-Modified and length, and each history file's. Any of them marks this table stale, and the next Census sync rebuilds it whole, every year from 2020 replaced by the new release.

Attribution

US Census Bureau, Population Estimates Program.

provenance/tn_nces_public_schools.md

↑ Contents

Provenance: tn_nces_public_schools

This file describes how the rows in PostgreSQL table tn_nces_public_schools were obtained from an external source: where they were fetched and how fields were renamed and typed. Field meanings are in the mapping table below.

Identity
Pipeline (NCES family)

NCES publishes each school year as two national ArcGIS MapServer services in the K12_School_Locations folder: EDGE_GEOCODE_PUBLICSCH_<yy> (the EDGE geocoded school locations) and EDGE_ADMINDATA_PUBLICSCH_<yy> (the Common Core of Data administrative attributes, with their own points). Every year from 2017–18 with both services is loaded. Each state's rows are cut on the server (STATE on the locations, LSTATE on the administrative layer, both the school's physical state, so Bureau of Indian Education schools land in the state they stand in) and walked by keyset on OBJECTID, one gzipped GeoJSON page per stored chunk (doc/NCES-SYNC.md).

The two layers are joined on (NCESSCH, school year). A school in either is a row: the location's point, name, address and geography win where both have them, and a school only in the administrative layer is placed by that layer's own point. The locations service is used for a year only when its SCHOOLYEAR is that year; NCES's 2018–19 locations service carries the 2017–18 list, so 2018–19 is built from the administrative layer alone.

Changed from the source: cut to Tennessee; the two layers joined by school; NCES's missing, not-applicable and suppressed codes (−1, −2, −9) stored as NULL; status, school type, virtual status and charter recoded to one vocabulary across years (their wording changed between collections); SCHOOLYEAR / SURVYEAR shortened to 2024-25; phone numbers, sex-by-race counts, adult education counts and the mailing-address lines dropped.

Public domain: each layer's description states "All information contained in this file is in the public domain" (doc/DATA-LICENSES.md).

Field → column mapping
Source fieldColumnEsri typeDescription
NCESSCHncesschStringBoth layers
SCHOOLYEAR, SURVYEARschool_yearString2024-2025 → 2024-25
LEAIDleaidStringAdministrative layer, else locations (2019–20 on)
ST_LEAIDst_leaidStringAdministrative layer
NAME, SCH_NAMEschool_nameStringLocations, else administrative
LEA_NAMEdistrict_nameStringAdministrative layer
STREET, LSTREET1streetStringLocations, else administrative
CITY, LCITYcityString
ZIP, LZIPzipString
CNTYcounty_fipsStringLocations; administrative layer from 2022–23
NMCNTYcounty_nameString
LOCALE, ULOCALElocaleStringLocations' code, else the code before ULOCALE's -
(from locale)locale_nameNCES's name for the code
CBSA, NMCBSAcbsa, cbsa_nameStringLocations only
CD, SLDL, SLDUcd, sldl, slduStringLocations only
STATUSstatusString1 Open, 3 New, 4 Added, 5 Changed boundary or agency, 6 Inactive, 7 Future, 8 Reopened
SCHOOL_TYPE_TEXTschool_typeStringRecoded across years
SCHOOL_LEVELschool_levelStringNot Reported / Not Applicable, in either case, → NULL
GSLO, GSHIgrade_low, grade_highStringM / N → NULL
CHARTER_TEXTcharterString → booleanYes / No (2019–20 1-Yes / 2-No); N, Missing and Not Applicable → NULL
VIRTUALvirtualStringRecoded across years; M, N, Missing, Not Reported, Not Applicable → NULL
MEMBERenrollmentInteger
PK, KG, G01–G13, UGenroll_pk, enroll_kg, enroll_g01–enroll_g13, enroll_ungradedInteger
FTEteachers_fteDouble
STUTERATIOstudent_teacher_ratioDouble
TOTFRL, FRELCH, REDLCHfrl_eligible, free_lunch, reduced_lunchInteger
DIRECTCERTdirect_certInteger2021–22 on
AM, AS, BL, HP, HI, TR, WHstudents_aian, students_asian, students_black, students_nhpi, students_hispanic, students_two_or_more, students_whiteInteger
PHONE, LSTREET2, LSTREET3, LZIP4, LSTATE, STABR, OPSTFIPS, STFIP, STATE, LAT, LON, LATCOD, LONCOD, CBSATYPE, CSA, NMCSA, NECTA, NMNECTA, TOTAL, TOTMENROL, TOTFENROL, AE, the *ALM / *ALF race-by-sex counts, MAGNET_TEXT, STITLEI, TITLEI, TITLEI_TEXT, SY_STATUS_TEXT(dropped)
Geometry
  • Source points, outSR 4326 (the 2022–23 on services are stored in NAD83, EPSG 4269).

© 2026 State Planner