
transcript.md
↑ ContentsState Planner chat · https://stateplanner.com
- State: Tennessee (TN)
- Started: October 22, 2026, 12:37 AM UTC
- Runtime: 46 sec
- Status: completed
Prompt
Which Tennessee cities and towns grew fastest since 2010, and which lost people? List the top 25 and map every place by percent change.
Model: Anthropic: Claude Opus 5.5 (anthropic/claude-opus-5.5, via openrouter)
Response
Population change in Tennessee's incorporated cities and towns, July 2010 to July 2025
I used the Census Bureau's population estimates for 2010 (the revised 2010–2019 series) and 2025 (the current Vintage 2025 release). 345 incorporated places have a figure in both years. Of those, 228 grew and 117 lost people. Census-designated places, which have no local government, have no estimates and aren't included. A few towns incorporated after 2010 have no 2010 figure and are left out too.
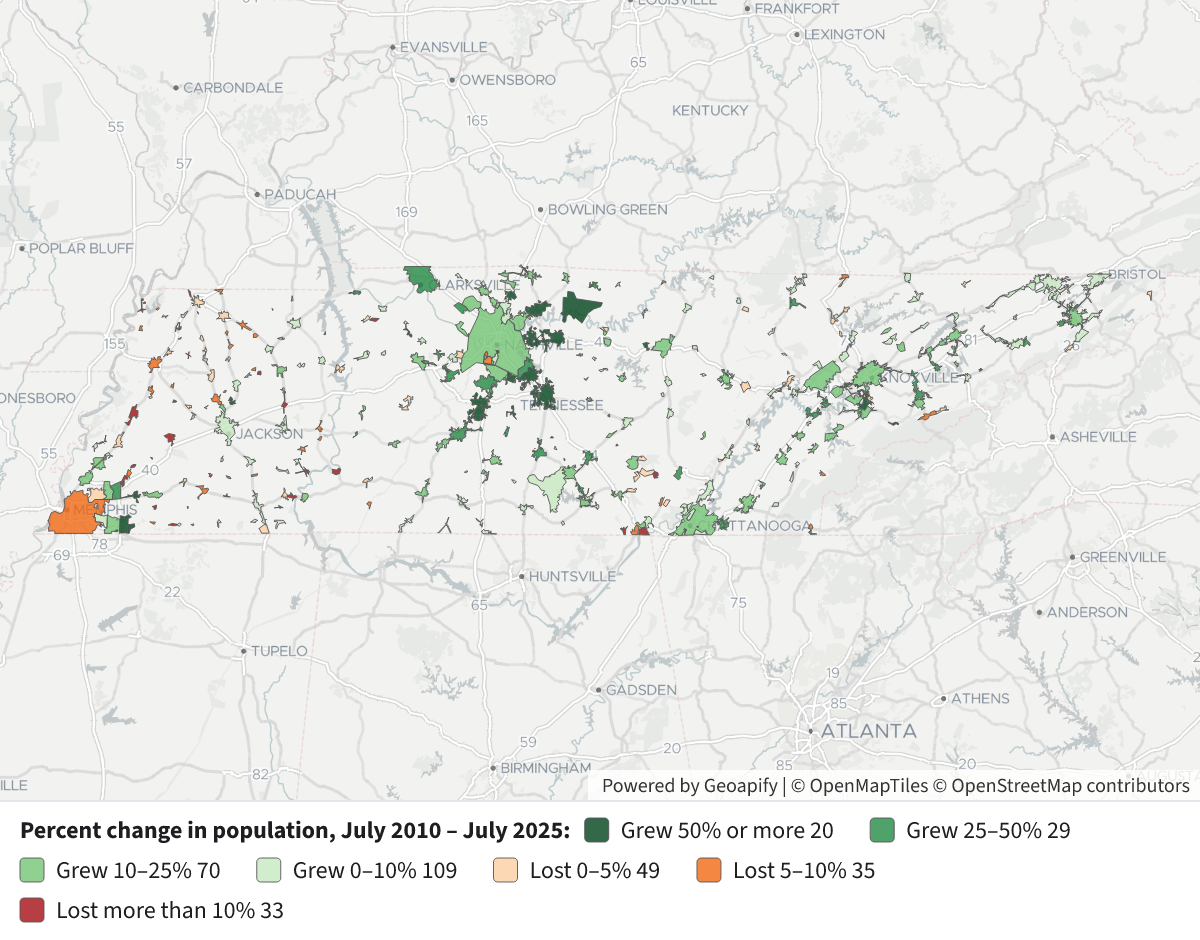
How to read the map: each city or town outline is colored by its percent change. Dark green means it grew 50% or more, then 25–50%, 10–25%, and the palest green 0–10%. Orange means a loss of 0–5% or 5–10%, and dark red a loss of more than 10%. Click a place to see its 2010 and 2025 populations. The fastest growth is in a ring of suburbs around Nashville, in Williamson, Rutherford, Wilson, Sumner and Maury counties. Most of the losses are in small West Tennessee towns.
25 fastest-growing places, 2010–2025 (all sizes)
| # | Place | 2010 | 2025 | Change | % |
|---|---|---|---|---|---|
| 1 | Thompson's Station town | 2,221 | 9,469 | +7,248 | +326.3% |
| 2 | Berry Hill city | 576 | 1,864 | +1,288 | +223.6% |
| 3 | Nolensville town | 6,065 | 15,789 | +9,724 | +160.3% |
| 4 | Spring Hill city | 29,419 | 61,336 | +31,917 | +108.5% |
| 5 | Lebanon city | 26,347 | 53,412 | +27,065 | +102.7% |
| 6 | Piperton city | 1,453 | 2,889 | +1,436 | +98.8% |
| 7 | Rossville town | 666 | 1,215 | +549 | +82.4% |
| 8 | Mount Juliet city | 25,017 | 45,172 | +20,155 | +80.6% |
| 9 | Gallatin city | 30,525 | 54,590 | +24,065 | +78.8% |
| 10 | White House city | 10,289 | 17,872 | +7,583 | +73.7% |
| 11 | Oakland town | 6,653 | 10,835 | +4,182 | +62.9% |
| 12 | Alcoa city | 8,430 | 13,689 | +5,259 | +62.4% |
| 13 | Medina city | 3,624 | 5,813 | +2,189 | +60.4% |
| 14 | Hartsville/Trousdale County | 7,874 | 12,623 | +4,749 | +60.3% |
| 15 | Baxter town | 1,361 | 2,128 | +767 | +56.4% |
| 16 | Vanleer town | 390 | 609 | +219 | +56.2% |
| 17 | Murfreesboro city | 109,631 | 171,178 | +61,547 | +56.1% |
| 18 | Smyrna town | 40,596 | 63,321 | +22,725 | +56.0% |
| 19 | Eagleville city | 625 | 964 | +339 | +54.2% |
| 20 | Townsend city | 422 | 640 | +218 | +51.7% |
| 21 | Lenoir City city | 8,602 | 12,530 | +3,928 | +45.7% |
| 22 | Columbia city | 34,737 | 50,072 | +15,335 | +44.1% |
| 23 | Franklin city | 62,796 | 90,226 | +27,430 | +43.7% |
| 24 | Charleston city | 651 | 923 | +272 | +41.8% |
| 25 | Clarksville city | 133,634 | 188,829 | +55,195 | +41.3% |
25 places with the largest percent loss, 2010–2025
| # | Place | 2010 | 2025 | Change | % |
|---|---|---|---|---|---|
| 1 | Crump city | 1,493 | 946 | −547 | −36.6% |
| 2 | Cumberland Gap town | 489 | 312 | −177 | −36.2% |
| 3 | Toone town | 369 | 264 | −105 | −28.5% |
| 4 | Cottage Grove town | 89 | 66 | −23 | −25.8% |
| 5 | Tiptonville town | 4,476 | 3,333 | −1,143 | −25.5% |
| 6 | Rives town | 326 | 244 | −82 | −25.2% |
| 7 | Orme town | 111 | 85 | −26 | −23.4% |
| 8 | Gallaway city | 670 | 520 | −150 | −22.4% |
| 9 | Hickory Valley town | 103 | 80 | −23 | −22.3% |
| 10 | Normandy town | 135 | 109 | −26 | −19.3% |
| 11 | Saltillo town | 535 | 441 | −94 | −17.6% |
| 12 | Parrottsville town | 276 | 228 | −48 | −17.4% |
| 13 | Yorkville city | 270 | 228 | −42 | −15.6% |
| 14 | Trimble town | 630 | 533 | −97 | −15.4% |
| 15 | Williston city | 399 | 338 | −61 | −15.3% |
| 16 | Mason town | 1,583 | 1,342 | −241 | −15.2% |
| 17 | Bell Buckle town | 493 | 419 | −74 | −15.0% |
| 18 | La Grange town | 142 | 121 | −21 | −14.8% |
| 19 | Obion town | 1,124 | 958 | −166 | −14.8% |
| 20 | Palmer town | 684 | 584 | −100 | −14.6% |
| 21 | Viola town | 130 | 111 | −19 | −14.6% |
| 22 | McLemoresville town | 347 | 301 | −46 | −13.3% |
| 23 | Clifton city | 2,692 | 2,344 | −348 | −12.9% |
| 24 | Burlison town | 419 | 368 | −51 | −12.2% |
| 25 | Woodland Mills city | 379 | 334 | −45 | −11.9% |
Other ways to look at it:
- Largest gains in people: Nashville-Davidson (the part outside its smaller cities) gained 115,976 (+19.2%). Next came Murfreesboro (+61,547), Clarksville (+55,195), Spring Hill (+31,917), Franklin (+27,430) and Lebanon (+27,065). Knoxville (+13.3%) and Chattanooga (+13.9%) each gained about 23,700.
- Losses among places of 2,500 or more people in 2010: Tiptonville (−25.5%), Clifton (−12.9%), Ripley (−10.6%), Brownsville (−10.2%), Belle Meade (−9.6%), Humboldt and Forest Hills (−7.4% each), Dyersburg (−7.1%), Gatlinburg (−6.7%) and Memphis (−6.5%). Memphis's −42,272 was the largest loss in people.
Caveats:
- These are estimates, not census counts, and the 2010 and 2025 figures come from two different estimate series.
- In very small towns a handful of people can swing the percentage a lot. Cottage Grove, for example, went from 89 to 66.
- Some growth may be land rather than new residents, because city limits move with annexation.
If you'd like, I can rerun this with a minimum population, measure from the 2010 census count instead of the July estimate, or show only 2020–2025.
JavaScript
status: ok purpose: Compute 2010–2025 change for every place and rank.
Code
let rows=[];let r;while((r=next('p'))!==null){r.pct=r.p10>0?(r.p25-r.p10)/r.p10*100:null;rows.push(r);}
let v=rows.filter(x=>x.pct!==null);
v.sort((a,b)=>b.pct-a.pct);
let big=v.filter(x=>x.p10>=2500);
let f=x=>({name:x.name,p10:x.p10,p25:x.p25,chg:x.p25-x.p10,pct:+x.pct.toFixed(1)});
let numChg=[...v].sort((a,b)=>(b.p25-b.p10)-(a.p25-a.p10));
result={n:rows.length,nogeom:rows.filter(x=>!x.has_geom).map(x=>x.name),zero:rows.filter(x=>x.pct===null).map(x=>x.name),
grew:v.filter(x=>x.pct>0).length,lost:v.filter(x=>x.pct<0).length,flat:v.filter(x=>x.pct===0).length,
topAll:v.slice(0,25).map(f),botAll:v.slice(-25).reverse().map(f),topBig:big.slice(0,25).map(f),botBig:big.slice(-15).reverse().map(f),topNum:numChg.slice(0,10).map(f),
bins:[[-100,-10],[-10,-5],[-5,0],[0,0.0001],[0.0001,10],[10,25],[25,50],[50,1e9]].map(b=>[b[0],v.filter(x=>x.pct>=b[0]&&x.pct<b[1]).length])};
SQL p
   SELECT a.geoid,
          a.name,
          a.pop_estimate p10,
          b.pop_estimate p25,
          (p.geoid IS NOT NULL) has_geom
     FROM tn_census_local_pop_est a
     JOIN tn_census_local_pop_est b ON b.geoid = a.geoid
      AND b.geo_type = 'place'
      AND b.series = 'postcensal'
      AND b.year = 2025
LEFT JOIN tn_census_places p ON p.geoid = a.geoid
    WHERE a.geo_type = 'place'
      AND a.series = 'intercensal'
      AND a.year = 2010
Result
Result is in the sidecar file.
Console
(empty)
Exploratory Queries
Query 1 — Check years available and place counts.
   SELECT series,
          min(YEAR),
          max(YEAR),
          count(DISTINCT geoid)
     FROM tn_census_local_pop_est
    WHERE geo_type = 'place'
 GROUP BY series
| series | min | max | count |
|---|---|---|---|
| census | 1980 | 1990 | 336 |
| intercensal | 2000 | 2019 | 348 |
| postcensal | 1990 | 2025 | 349 |
Map Layer Queries
Percent change in population, July 2010 – July 2025 — colored by "cls": Grew 50% or more (#00441b), Grew 25–50% (#238b45), Grew 10–25% (#74c476), Grew 0–10% (#c7e9c0), Lost 0–5% (#fdd0a2), Lost 5–10% (#f16913), Lost more than 10% (#a50f15)
     WITH c AS (
             SELECT a.geoid,
                    a.name,
                    a.pop_estimate p10,
                    b.pop_estimate p25,
                    round(100.0 * (b.pop_estimate - a.pop_estimate) / a.pop_estimate, 1) pct
               FROM tn_census_local_pop_est a
               JOIN tn_census_local_pop_est b ON b.geoid = a.geoid
                AND b.geo_type = 'place'
                AND b.series = 'postcensal'
                AND b.year = 2025
              WHERE a.geo_type = 'place'
                AND a.series = 'intercensal'
                AND a.year = 2010
          )
   SELECT p.geom,
          c.name AS "Place",
          c.p10 AS "Pop. 2010",
          c.p25 AS "Pop. 2025",
          c.p25 - c.p10 AS "Change",
          c.pct AS "% change",
          CASE
                    WHEN pct >= 50 THEN 'a'
                    WHEN pct >= 25 THEN 'b'
                    WHEN pct >= 10 THEN 'c'
                    WHEN pct >= 0 THEN 'd'
                    WHEN pct >= -5 THEN 'e'
                    WHEN pct >= -10 THEN 'f'
                    ELSE 'g'
          END AS cls
     FROM c
     JOIN tn_census_places p ON p.geoid = c.geoid
Picture: maps/turn-1-place-pop-change.png
Used Data Sets
tn_census_local_pop_est— last synced 2026-10-15 · 30,937 rowstn_census_places— last synced 2026-10-09 · 504 rows