transcript.md
↑ ContentsState Planner chat · https://stateplanner.com
- State: Washington (WA)
- Started: November 6, 2026, 7:35 PM UTC
- Runtime: 1 min 40 sec
- Status: completed
Prompt
What is the land area in square miles of each Washington county subdivision, and how many people live per square mile?
Model: Anthropic: Claude Opus 5.5 (anthropic/claude-opus-5.5, via openrouter)
Response
How much land each Washington county subdivision covers, and how many people live on it
Washington has 242 county subdivisions. All of them are census county divisions (CCDs), areas the Census Bureau draws only for statistics. None of them has a local government (funcstat = S).
How the figures were built
- Land area is the Census TIGER land area (
aland_m2), converted to square miles. Water isn't counted. - Population is the 2020 census count. That is a full count, not a survey estimate. The Census Bureau's yearly population estimates only cover subdivisions that have a government, so there are no estimates for Washington's CCDs. Instead I added up the 2020 census counts of the block groups inside each subdivision, placing each block group by a point inside it.
- The block groups nest almost exactly inside the subdivisions. All 5,311 block groups were placed and the total comes to 7,705,281, which is the state's 2020 count. Only 13 block groups, with 3,670 people between them, cross a subdivision line by more than 5% of their area.
- Density is the 2020 population divided by land area.
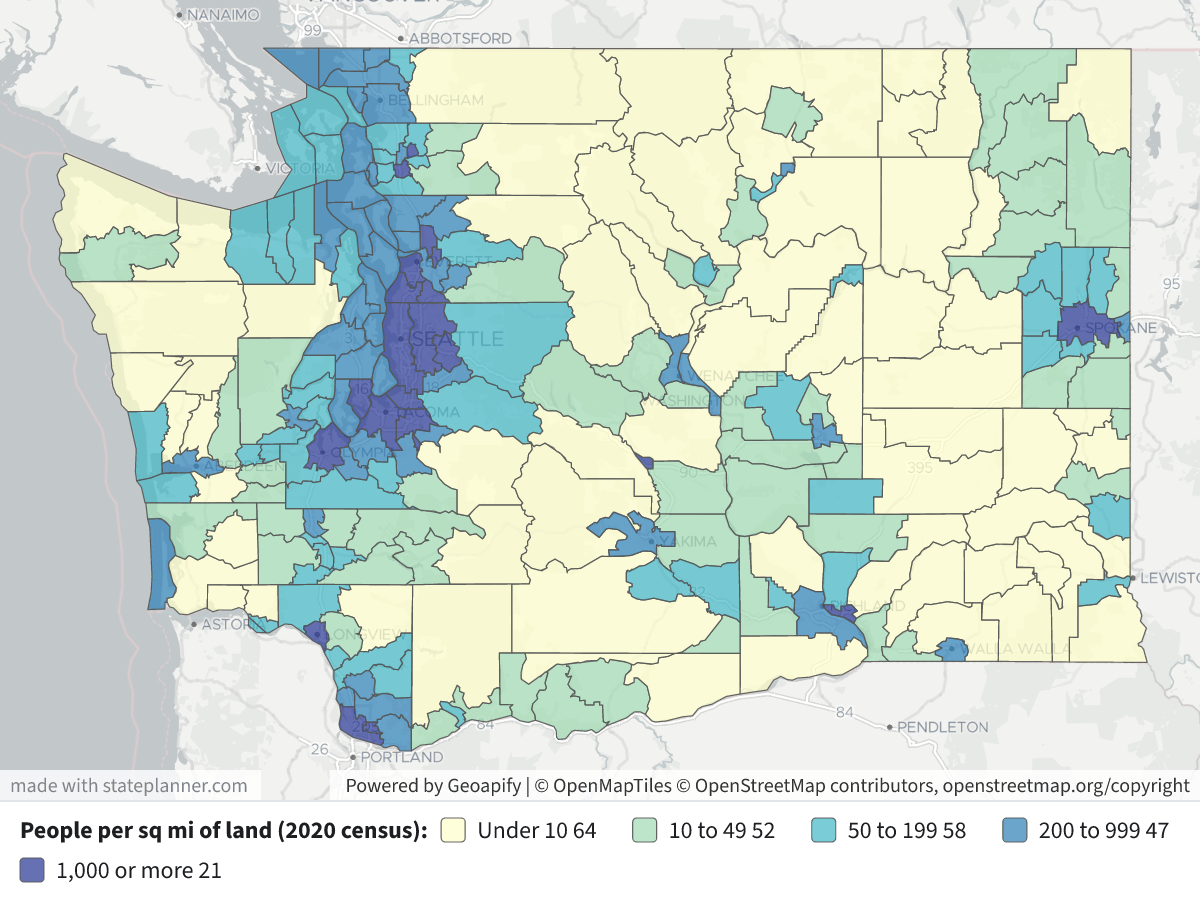
Map legend: subdivisions are shaded by people per square mile of land: pale yellow under 10, light green 10–49, teal 50–199, blue 200–999, and dark blue 1,000 or more. Click a subdivision to see its land area, population and density.
Highest density
| Subdivision | County | Land (sq mi) | 2020 pop. | People per sq mi |
|---|---|---|---|---|
| Seattle | King | 186.8 | 1,139,259 | 6,100 |
| Edmonds | Snohomish | 58.5 | 274,548 | 4,692 |
| Orchards | Clark | 16.2 | 73,318 | 4,518 |
| Everett | Snohomish | 44.3 | 196,345 | 4,434 |
| Federal Way-Auburn | King | 55.5 | 192,023 | 3,459 |
| Tacoma | Pierce | 138.9 | 480,342 | 3,458 |
| Seattle East | King | 216.8 | 639,295 | 2,949 |
| Vancouver | Clark | 87.8 | 254,087 | 2,895 |
Lowest density
| Subdivision | County | Land (sq mi) | 2020 pop. | People per sq mi |
|---|---|---|---|---|
| Hanford Site | Benton | 440.4 | 21 | 0.05 |
| North Skamania | Skamania | 1,378.7 | 104 | 0.08 |
| Early Winters | Okanogan | 1,056.9 | 529 | 0.5 |
| West End | Jefferson | 1,103.4 | 776 | 0.7 |
| South Benton | Benton | 597.6 | 835 | 1.4 |
| Starbuck | Columbia | 346.2 | 488 | 1.4 |
Size range
- Largest: East Whatcom (1,635 sq mi) and South Yakima (1,784 sq mi).
- Smallest: Point Roberts (4.9 sq mi) and Puget Island (7.9 sq mi).
Pattern on the map: subdivisions with 1,000 or more people per square mile are in the Puget Sound corridor from Everett to Olympia, plus Vancouver/Orchards, Spokane, Pasco, Longview-Kelso, Mount Vernon, Sedro-Woolley and Ellensburg. Most subdivisions east of the Cascades and in the mountains have fewer than 10 people per square mile.
Full table (all 242 subdivisions)
| County | Subdivision | Land sq mi | 2020 pop. | Per sq mi |
|---|---|---|---|---|
| Adams | Lind-Washtucna | 1016.3 | 1,804 | 1.8 |
| Adams | Othello | 286.1 | 16,230 | 56.7 |
| Adams | Ritzville | 622.6 | 2,579 | 4.1 |
| Asotin | Asotin | 517.5 | 4,392 | 8.5 |
| Asotin | Clarkston | 118.6 | 17,893 | 150.9 |
| Benton | Benton City | 63.7 | 6,355 | 99.7 |
| Benton | Hanford Site | 440.4 | 21 | 0.0 |
| Benton | Northwest Benton | 352.0 | 13,977 | 39.7 |
| Benton | Richland-Kennewick | 246.3 | 185,685 | 753.9 |
| Benton | South Benton | 597.6 | 835 | 1.4 |
| Chelan | Cashmere | 324.8 | 11,462 | 35.3 |
| Chelan | Chelan | 175.5 | 7,084 | 40.4 |
| Chelan | Entiat | 467.1 | 1,482 | 3.2 |
| Chelan | Leavenworth-Lake Wenatchee | 982.8 | 6,930 | 7.1 |
| Chelan | Malaga | 121.8 | 4,531 | 37.2 |
| Chelan | Manson | 52.9 | 4,034 | 76.3 |
| Chelan | Stehekin | 710.5 | 1,179 | 1.7 |
| Chelan | Wenatchee | 85.8 | 42,372 | 493.9 |
| Clallam | Agnew-Carlsborg | 106.5 | 11,820 | 111.0 |
| Clallam | Clallam Bay-Neah Bay | 401.1 | 3,399 | 8.5 |
| Clallam | Crescent | 411.7 | 3,451 | 8.4 |
| Clallam | Forks | 432.7 | 6,365 | 14.7 |
| Clallam | Port Angeles | 250.9 | 31,103 | 124.0 |
| Clallam | Sequim | 135.8 | 21,017 | 154.7 |
| Clark | Battle Ground | 154.3 | 72,056 | 467.0 |
| Clark | Camas | 113.5 | 64,125 | 565.2 |
| Clark | La Center | 73.6 | 16,547 | 224.9 |
| Clark | Orchards | 16.2 | 73,318 | 4518.0 |
| Clark | Ridgefield | 33.6 | 13,669 | 407.0 |
| Clark | Vancouver | 87.8 | 254,087 | 2894.7 |
| Clark | Yacolt | 149.6 | 9,509 | 63.6 |
| Columbia | Dayton | 522.4 | 3,464 | 6.6 |
| Columbia | Starbuck | 346.2 | 488 | 1.4 |
| Cowlitz | Castle Rock | 274.3 | 15,981 | 58.3 |
| Cowlitz | Kalama | 41.7 | 7,271 | 174.3 |
| Cowlitz | Longview-Kelso | 45.5 | 66,339 | 1457.5 |
| Cowlitz | Northeast Cowlitz | 443.7 | 2,144 | 4.8 |
| Cowlitz | Rose Valley | 152.0 | 5,857 | 38.5 |
| Cowlitz | Woodland | 184.0 | 13,138 | 71.4 |
| Douglas | Bridgeport | 832.2 | 6,638 | 8.0 |
| Douglas | East Wenatchee | 81.5 | 33,848 | 415.6 |
| Douglas | Waterville | 905.6 | 2,452 | 2.7 |
| Ferry | Colville Reservation | 1084.0 | 1,713 | 1.6 |
| Ferry | Curlew | 304.3 | 1,291 | 4.2 |
| Ferry | East Ferry | 469.7 | 1,238 | 2.6 |
| Ferry | Republic | 345.2 | 2,936 | 8.5 |
| Franklin | Connell | 454.5 | 9,679 | 21.3 |
| Franklin | Kahlotus | 543.7 | 1,499 | 2.8 |
| Franklin | Pasco | 34.5 | 61,826 | 1794.5 |
| Franklin | Pasco North | 209.0 | 23,745 | 113.6 |
| Garfield | Pomeroy | 204.6 | 1,430 | 7.0 |
| Garfield | Snake River | 506.2 | 856 | 1.7 |
| Grant | Coulee City | 485.2 | 1,483 | 3.1 |
| Grant | Ephrata-Soap Lake | 310.0 | 19,645 | 63.4 |
| Grant | George | 329.6 | 3,327 | 10.1 |
| Grant | Gloyd | 103.1 | 2,304 | 22.3 |
| Grant | Grand Coulee | 40.4 | 2,150 | 53.3 |
| Grant | Mattawa-Royal City | 634.5 | 15,058 | 23.7 |
| Grant | Moses Lake | 67.0 | 39,517 | 589.7 |
| Grant | Quincy | 279.9 | 10,942 | 39.1 |
| Grant | Warden | 110.0 | 3,687 | 33.5 |
| Grant | Wilson Creek | 319.9 | 1,010 | 3.2 |
| Grays Harbor | Aberdeen-Hoquiam | 85.0 | 32,571 | 383.1 |
| Grays Harbor | Elma | 52.2 | 7,186 | 137.7 |
| Grays Harbor | Humptulips | 177.2 | 1,270 | 7.2 |
| Grays Harbor | Malone-Porter | 113.6 | 1,785 | 15.7 |
| Grays Harbor | McCleary | 38.3 | 4,110 | 107.4 |
| Grays Harbor | Montesano | 250.7 | 6,905 | 27.5 |
| Grays Harbor | Neilton | 207.0 | 557 | 2.7 |
| Grays Harbor | North River | 165.2 | 579 | 3.5 |
| Grays Harbor | Oakville | 99.5 | 2,376 | 23.9 |
| Grays Harbor | Ocean Shores | 122.7 | 8,746 | 71.3 |
| Grays Harbor | Quinault Reservation | 302.3 | 1,369 | 4.5 |
| Grays Harbor | Westport | 113.8 | 6,701 | 58.9 |
| Grays Harbor | Wishkah | 174.9 | 1,481 | 8.5 |
| Island | Camano Island | 39.9 | 17,356 | 434.8 |
| Island | Central Whidbey Island | 52.6 | 13,605 | 258.7 |
| Island | North Whidbey Island | 57.1 | 40,814 | 714.6 |
| Island | South Whidbey Island | 59.1 | 15,082 | 255.2 |
| Jefferson | Discovery Bay-Port Townsend | 70.3 | 17,757 | 252.7 |
| Jefferson | Oak Bay-Port Ludlow | 93.8 | 11,167 | 119.0 |
| Jefferson | Quilcene Bay-Brinnon | 536.2 | 3,277 | 6.1 |
| Jefferson | West End | 1103.4 | 776 | 0.7 |
| King | Enumclaw Plateau | 556.3 | 71,804 | 129.1 |
| King | Federal Way-Auburn | 55.5 | 192,023 | 3458.5 |
| King | Issaquah Plateau | 79.7 | 88,088 | 1105.2 |
| King | Seattle | 186.8 | 1,139,259 | 6100.0 |
| King | Seattle East | 216.8 | 639,295 | 2949.3 |
| King | Snoqualmie Valley | 893.9 | 56,276 | 63.0 |
| King | Tahoma-Maple Valley | 89.8 | 71,875 | 800.2 |
| King | Vashon Island | 37.0 | 11,055 | 298.9 |
| Kitsap | Bainbridge Island | 27.6 | 24,825 | 899.0 |
| Kitsap | Bremerton | 135.9 | 116,318 | 856.0 |
| Kitsap | Kingston | 36.6 | 12,564 | 343.3 |
| Kitsap | Port Orchard | 119.8 | 75,331 | 628.7 |
| Kitsap | Poulsbo | 75.2 | 46,573 | 619.5 |
| Kittitas | Cle Elum | 682.2 | 7,465 | 10.9 |
| Kittitas | Ellensburg | 17.3 | 21,224 | 1229.5 |
| Kittitas | Kittitas | 410.2 | 4,727 | 11.5 |
| Kittitas | Manastash Ridge | 594.4 | 5,675 | 9.5 |
| Kittitas | Northeast Kittitas | 593.2 | 5,246 | 8.8 |
| Klickitat | Dallesport-Klickitat | 350.0 | 4,524 | 12.9 |
| Klickitat | Goldendale | 416.2 | 7,525 | 18.1 |
| Klickitat | Horse Heaven Hills Plateau | 649.4 | 949 | 1.5 |
| Klickitat | White Salmon | 244.1 | 9,279 | 38.0 |
| Klickitat | Yakama Nation Reservation | 211.9 | 458 | 2.2 |
| Lewis | Big Bottom | 675.1 | 2,877 | 4.3 |
| Lewis | Bunker | 174.1 | 3,670 | 21.1 |
| Lewis | Centralia-Chehalis | 58.2 | 34,206 | 588.0 |
| Lewis | Ethel | 55.1 | 3,828 | 69.5 |
| Lewis | Logan Hill | 136.0 | 4,398 | 32.3 |
| Lewis | Mineral | 432.1 | 4,612 | 10.7 |
| Lewis | Morton | 208.6 | 2,865 | 13.7 |
| Lewis | Mossyrock | 257.7 | 5,079 | 19.7 |
| Lewis | Napavine | 41.2 | 5,983 | 145.2 |
| Lewis | Newaukum Prairie | 21.2 | 2,923 | 138.1 |
| Lewis | Toledo-Vader | 70.5 | 4,046 | 57.4 |
| Lewis | Winlock-Pe Ell | 273.0 | 7,662 | 28.1 |
| Lincoln | Davenport | 546.3 | 5,037 | 9.2 |
| Lincoln | Odessa | 1026.7 | 2,987 | 2.9 |
| Lincoln | Wilbur | 737.6 | 2,852 | 3.9 |
| Mason | Belfair-Tahuya | 105.0 | 9,439 | 89.9 |
| Mason | Kamilche | 68.4 | 3,680 | 53.8 |
| Mason | Shelton | 50.2 | 21,958 | 437.5 |
| Mason | Skokomish Reservation | 8.3 | 723 | 87.2 |
| Mason | Timber Lake-Harstine Island | 55.3 | 8,340 | 150.9 |
| Mason | Union-Grapeview | 88.7 | 14,831 | 167.3 |
| Mason | West Mason | 583.8 | 6,755 | 11.6 |
| Okanogan | Brewster-Wakefield | 208.8 | 4,680 | 22.4 |
| Okanogan | Colville Reservation | 1031.8 | 6,091 | 5.9 |
| Okanogan | Conconully-Riverside | 398.9 | 2,511 | 6.3 |
| Okanogan | Early Winters | 1056.9 | 529 | 0.5 |
| Okanogan | Methow Valley | 1025.9 | 6,353 | 6.2 |
| Okanogan | Okanogan | 33.7 | 4,036 | 119.7 |
| Okanogan | Omak | 15.6 | 6,715 | 431.7 |
| Okanogan | Oroville | 1268.5 | 7,306 | 5.8 |
| Okanogan | Tonasket | 226.3 | 3,883 | 17.2 |
| Pacific | Long Beach-North Beach Peninsula | 52.7 | 10,955 | 207.8 |
| Pacific | Naselle | 331.2 | 2,377 | 7.2 |
| Pacific | Raymond | 300.5 | 8,385 | 27.9 |
| Pacific | Willapa Valley | 249.0 | 1,648 | 6.6 |
| Pend Oreille | Ione-Metaline Falls | 672.3 | 2,079 | 3.1 |
| Pend Oreille | Newport | 727.9 | 11,322 | 15.6 |
| Pierce | Buckley | 50.9 | 28,995 | 570.1 |
| Pierce | Eatonville | 211.4 | 6,418 | 30.4 |
| Pierce | Fort Lewis-DuPont | 120.7 | 34,248 | 283.7 |
| Pierce | Gig Harbor Peninsula | 54.3 | 56,353 | 1037.5 |
| Pierce | Graham-Thrift | 106.5 | 97,274 | 913.1 |
| Pierce | Key Peninsula-Anderson Island | 69.1 | 15,548 | 225.1 |
| Pierce | Mount Rainier | 732.4 | 3,900 | 5.3 |
| Pierce | Puyallup | 92.2 | 181,567 | 1969.4 |
| Pierce | Roy | 91.6 | 16,485 | 179.9 |
| Pierce | Tacoma | 138.9 | 480,342 | 3458.4 |
| San Juan | Lopez | 48.1 | 3,156 | 65.6 |
| San Juan | Orcas | 64.6 | 6,000 | 92.8 |
| San Juan | San Juan Island | 61.2 | 8,632 | 141.0 |
| Skagit | Anacortes | 49.6 | 22,735 | 458.2 |
| Skagit | Bay View | 22.6 | 3,874 | 171.6 |
| Skagit | Bow | 73.5 | 6,568 | 89.4 |
| Skagit | Burlington | 18.1 | 13,427 | 740.1 |
| Skagit | Clear Lake | 23.7 | 2,155 | 90.9 |
| Skagit | Conway | 63.1 | 3,873 | 61.4 |
| Skagit | East Skagit | 903.0 | 5,099 | 5.6 |
| Skagit | La Conner | 32.8 | 3,521 | 107.5 |
| Skagit | Lake Cavanaugh | 293.0 | 3,604 | 12.3 |
| Skagit | Lyman-Hamilton | 142.2 | 3,086 | 21.7 |
| Skagit | Mount Vernon | 21.5 | 38,580 | 1794.7 |
| Skagit | Sedro-Woolley | 12.7 | 15,326 | 1202.4 |
| Skagit | Swinomish Reservation | 11.9 | 3,228 | 271.0 |
| Skagit | Upper Samish River | 62.5 | 4,447 | 71.2 |
| Skamania | Carson-Underwood | 120.6 | 4,869 | 40.4 |
| Skamania | North Bonneville | 128.9 | 5,048 | 39.2 |
| Skamania | North Skamania | 1378.7 | 104 | 0.1 |
| Skamania | Stevenson | 30.0 | 2,015 | 67.1 |
| Snohomish | Arlington | 134.4 | 32,120 | 239.0 |
| Snohomish | Darrington | 651.3 | 3,282 | 5.0 |
| Snohomish | Edmonds | 58.5 | 274,548 | 4692.1 |
| Snohomish | Everett | 44.3 | 196,345 | 4434.4 |
| Snohomish | Granite Falls | 228.2 | 16,432 | 72.0 |
| Snohomish | Lake Stevens | 15.1 | 27,232 | 1800.2 |
| Snohomish | Maltby | 47.6 | 57,605 | 1210.0 |
| Snohomish | Marysville | 42.1 | 77,689 | 1846.7 |
| Snohomish | Monroe | 59.9 | 33,467 | 558.8 |
| Snohomish | Snohomish | 77.9 | 42,329 | 543.1 |
| Snohomish | Stanwood | 140.6 | 40,097 | 285.2 |
| Snohomish | Sultan | 551.9 | 15,842 | 28.7 |
| Snohomish | Tulalip Reservation | 34.7 | 10,969 | 316.1 |
| Spokane | Airway Heights | 182.7 | 16,869 | 92.3 |
| Spokane | Amber-Cheney South | 249.1 | 3,795 | 15.2 |
| Spokane | Cheney-Medical Lake | 141.4 | 27,921 | 197.5 |
| Spokane | Colbert | 151.6 | 11,807 | 77.9 |
| Spokane | Deer Park | 178.9 | 35,365 | 197.7 |
| Spokane | Liberty Lake | 32.7 | 20,321 | 621.4 |
| Spokane | Mount Spokane | 152.5 | 6,333 | 41.5 |
| Spokane | Rockford | 332.6 | 3,417 | 10.3 |
| Spokane | Spokane | 206.1 | 399,752 | 1939.7 |
| Spokane | Spokane South | 58.1 | 10,309 | 177.3 |
| Spokane | Valleyford | 78.6 | 3,450 | 43.9 |
| Stevens | Chewelah | 321.9 | 5,825 | 18.1 |
| Stevens | Colville | 469.9 | 11,654 | 24.8 |
| Stevens | Hunters-Gifford | 262.0 | 1,659 | 6.3 |
| Stevens | Kettle Falls | 670.6 | 7,935 | 11.8 |
| Stevens | Loon Lake | 175.4 | 11,322 | 64.5 |
| Stevens | Spokane Reservation | 238.0 | 2,541 | 10.7 |
| Stevens | Springdale | 339.4 | 5,509 | 16.2 |
| Thurston | Olympia | 124.6 | 189,652 | 1522.0 |
| Thurston | Olympia East | 69.7 | 41,062 | 589.1 |
| Thurston | Olympia West | 152.8 | 20,700 | 135.4 |
| Thurston | Thurston South | 375.4 | 43,379 | 115.6 |
| Wahkiakum | Cathlamet | 28.5 | 1,758 | 61.8 |
| Wahkiakum | Grays River | 101.0 | 864 | 8.6 |
| Wahkiakum | Puget Island | 7.9 | 929 | 117.9 |
| Wahkiakum | Skamokawa | 125.6 | 871 | 6.9 |
| Walla Walla | Burbank | 121.3 | 4,040 | 33.3 |
| Walla Walla | Eureka Flat | 510.5 | 1,678 | 3.3 |
| Walla Walla | Touchet | 117.7 | 2,130 | 18.1 |
| Walla Walla | Waitsburg | 450.5 | 2,947 | 6.5 |
| Walla Walla | Walla Walla-College Place | 70.1 | 51,789 | 739.2 |
| Whatcom | Bellingham | 145.2 | 122,006 | 840.2 |
| Whatcom | Blaine | 61.9 | 22,324 | 360.5 |
| Whatcom | East Whatcom | 1635.2 | 8,589 | 5.3 |
| Whatcom | Ferndale | 114.2 | 36,789 | 322.2 |
| Whatcom | Lummi Island | 9.3 | 934 | 100.9 |
| Whatcom | Lummi Reservation | 20.9 | 5,748 | 275.3 |
| Whatcom | Lynden | 46.4 | 20,184 | 434.9 |
| Whatcom | Point Roberts | 4.9 | 1,191 | 243.8 |
| Whatcom | Sumas | 70.0 | 9,082 | 129.8 |
| Whitman | Colfax-Palouse | 235.2 | 5,063 | 21.5 |
| Whitman | Garfield-Oakesdale | 250.5 | 1,957 | 7.8 |
| Whitman | LaCrosse | 509.0 | 864 | 1.7 |
| Whitman | Pullman | 191.0 | 34,988 | 183.1 |
| Whitman | Rock Lake | 608.9 | 1,722 | 2.8 |
| Whitman | Rosalia | 127.2 | 1,147 | 9.0 |
| Whitman | Tekoa | 56.9 | 972 | 17.1 |
| Whitman | Uniontown | 180.5 | 1,260 | 7.0 |
| Yakima | Mabton | 150.2 | 3,010 | 20.0 |
| Yakima | Northeast Yakima | 427.7 | 10,335 | 24.2 |
| Yakima | Northwest Yakima | 1177.6 | 8,608 | 7.3 |
| Yakima | South Yakima | 1784.3 | 3,553 | 2.0 |
| Yakima | Sunnyside | 302.2 | 52,868 | 174.9 |
| Yakima | Toppenish-Wapato | 214.5 | 27,548 | 128.4 |
| Yakima | Yakima | 237.9 | 150,806 | 633.8 |
These are 2020 census counts, not current figures. If you want present-day density, it's available for counties (from the 2024 county estimates) or for incorporated cities (from the place estimates), but not for these subdivisions.
Exploratory Queries
Query 1 — Check whether Washington subdivisions are statistical and have estimates.
   SELECT (
             SELECT string_agg(DISTINCT funcstat, ',')
               FROM wa_census_county_subdivisions
          ) f,
          (
             SELECT count(*)
               FROM wa_census_local_pop_est
              WHERE geo_type = 'county_subdivision'
          ) n
| f | n |
|---|---|
| S | 0 |
Query 2 — Test assigning 2020 block group counts to subdivisions by interior point.
     WITH bg AS (
             SELECT b.geoid,
                    ST_PointOnSurface(b.geom) p,
                    d.pop_total
               FROM wa_census_block_groups b
               JOIN wa_census_bg_decennial d ON d.geoid = b.geoid
                AND d.year = 2020
          ),
          a AS (
             SELECT s.geoid,
                    bg.pop_total
               FROM bg
               JOIN wa_census_county_subdivisions s ON ST_Intersects(s.geom, bg.p)
          )
   SELECT count(*) bgs,
          sum(pop_total) pop,
          count(DISTINCT geoid) subs
     FROM a
| bgs | pop | subs |
|---|---|---|
| 5311 | 7705281 | 242 |
Query 3 — Check how many block groups cross subdivision lines.
     WITH bg AS (
             SELECT b.geoid,
                    b.geom,
                    ST_PointOnSurface(b.geom) p,
                    d.pop_total
               FROM wa_census_block_groups b
               JOIN wa_census_bg_decennial d ON d.geoid = b.geoid
                AND d.year = 2020
          ),
          a AS (
             SELECT bg.pop_total,
                    ST_Area(ST_Intersection(s.geom, bg.geom)) / NULLIF(ST_Area(bg.geom), 0) f
               FROM bg
               JOIN wa_census_county_subdivisions s ON ST_Intersects(s.geom, bg.p)
          )
   SELECT count(*) FILTER (
              WHERE f < 0.95
          ) straddle,
          sum(pop_total) FILTER (
              WHERE f < 0.95
          ) straddle_pop
     FROM a
| straddle | straddle_pop |
|---|---|
| 13 | 3670 |
Query 4 — Land area and 2020 population density for each county subdivision.
     WITH bg AS (
             SELECT ST_PointOnSurface(b.geom) p,
                    d.pop_total
               FROM wa_census_block_groups b
               JOIN wa_census_bg_decennial d ON d.geoid = b.geoid
                AND d.year = 2020
          ),
          pop AS (
             SELECT s.geoid,
                    sum(bg.pop_total) pop
               FROM bg
               JOIN wa_census_county_subdivisions s ON ST_Intersects(s.geom, bg.p)
           GROUP BY s.geoid
          )
   SELECT s.basename,
          replace(c.name, ' County', '') county,
          round(s.aland_m2 / 2589988.11::numeric, 1) sqmi,
          p.pop,
          round(p.pop / (s.aland_m2 / 2589988.11::numeric), 1) dens
     FROM wa_census_county_subdivisions s
     JOIN pop p USING (geoid)
     JOIN wa_census_counties c ON c.geoid = s.county_geoid
 ORDER BY county,
          s.basename
| basename | county | sqmi | pop | dens |
|---|---|---|---|---|
| Lind-Washtucna | Adams | 1016.3 | 1804 | 1.8 |
| Othello | Adams | 286.1 | 16230 | 56.7 |
| Ritzville | Adams | 622.6 | 2579 | 4.1 |
| Asotin | Asotin | 517.5 | 4392 | 8.5 |
| Clarkston | Asotin | 118.6 | 17893 | 150.9 |
| Benton City | Benton | 63.7 | 6355 | 99.7 |
| Hanford Site | Benton | 440.4 | 21 | 0.0 |
| Northwest Benton | Benton | 352.0 | 13977 | 39.7 |
| Richland-Kennewick | Benton | 246.3 | 185685 | 753.9 |
| South Benton | Benton | 597.6 | 835 | 1.4 |
| Cashmere | Chelan | 324.8 | 11462 | 35.3 |
| Chelan | Chelan | 175.5 | 7084 | 40.4 |
| Entiat | Chelan | 467.1 | 1482 | 3.2 |
| Leavenworth-Lake Wenatchee | Chelan | 982.8 | 6930 | 7.1 |
| Malaga | Chelan | 121.8 | 4531 | 37.2 |
| Manson | Chelan | 52.9 | 4034 | 76.3 |
| Stehekin | Chelan | 710.5 | 1179 | 1.7 |
| Wenatchee | Chelan | 85.8 | 42372 | 493.9 |
| Agnew-Carlsborg | Clallam | 106.5 | 11820 | 111.0 |
| Clallam Bay-Neah Bay | Clallam | 401.1 | 3399 | 8.5 |
| Crescent | Clallam | 411.7 | 3451 | 8.4 |
| Forks | Clallam | 432.7 | 6365 | 14.7 |
| Port Angeles | Clallam | 250.9 | 31103 | 124.0 |
| Sequim | Clallam | 135.8 | 21017 | 154.7 |
| Battle Ground | Clark | 154.3 | 72056 | 467.0 |
25 out of 242 are listed here.
Map Layer Queries
People per sq mi of land (2020 census) — colored by "cls": Under 10 (#ffffcc), 10 to 49 (#a1dab4), 50 to 199 (#41b6c4), 200 to 999 (#2c7fb8), 1,000 or more (#253494)
     WITH bg AS (
             SELECT ST_PointOnSurface(b.geom) p,
                    d.pop_total
               FROM wa_census_block_groups b
               JOIN wa_census_bg_decennial d ON d.geoid = b.geoid
                AND d.year = 2020
          ),
          pop AS (
             SELECT s.geoid,
                    sum(bg.pop_total) pop
               FROM bg
               JOIN wa_census_county_subdivisions s ON ST_Intersects(s.geom, bg.p)
           GROUP BY s.geoid
          ),
          t AS (
             SELECT s.geom,
                    s.name,
                    replace(c.name, ' County', '') county,
                    round(s.aland_m2 / 2589988.11::numeric, 1) sqmi,
                    p.pop,
                    round(p.pop / (s.aland_m2 / 2589988.11::numeric), 1) dens
               FROM wa_census_county_subdivisions s
               JOIN pop p USING (geoid)
               JOIN wa_census_counties c ON c.geoid = s.county_geoid
          )
   SELECT geom,
          name AS "Subdivision",
          county AS "County",
          sqmi AS "Land area(sq mi)",
          pop AS "Population(2020 census)",
          dens AS "People per sq mi",
          CASE
                    WHEN dens < 10 THEN 'a'
                    WHEN dens < 50 THEN 'b'
                    WHEN dens < 200 THEN 'c'
                    WHEN dens < 1000 THEN 'd'
                    ELSE 'e'
          END AS cls
     FROM t
Picture: maps/turn-1-subdivision-population-density.png
Used Data Sets
wa_census_bg_decennial— last synced 2026-10-16 · 21,229 rowswa_census_block_groups— last synced 2026-09-27 · 5,311 rowswa_census_counties— last synced 2026-09-27 · 39 rowswa_census_county_subdivisions— last synced 2026-10-09 · 242 rowswa_census_local_pop_est— last synced 2026-10-15 · 22,926 rows