
State Planner

Ohio · October 29, 2026

Traffic Count Stations by AADT

This is a real answer State Planner produced from Ohio’s public data.

Ask this question, or one like it, in State Planner now. Sign up to try every feature free for 7 days, no card needed, and the question will be waiting in your new chat to change or send.

Ask this in State Planner →
  1. ODOT Traffic Count Stations by Annual Daily Traffic


    ODOT traffic count stations by annual average daily traffic (AADT)

    Traffic Count Stations by AADTTraffic Count Stations by AADT⬇ Image

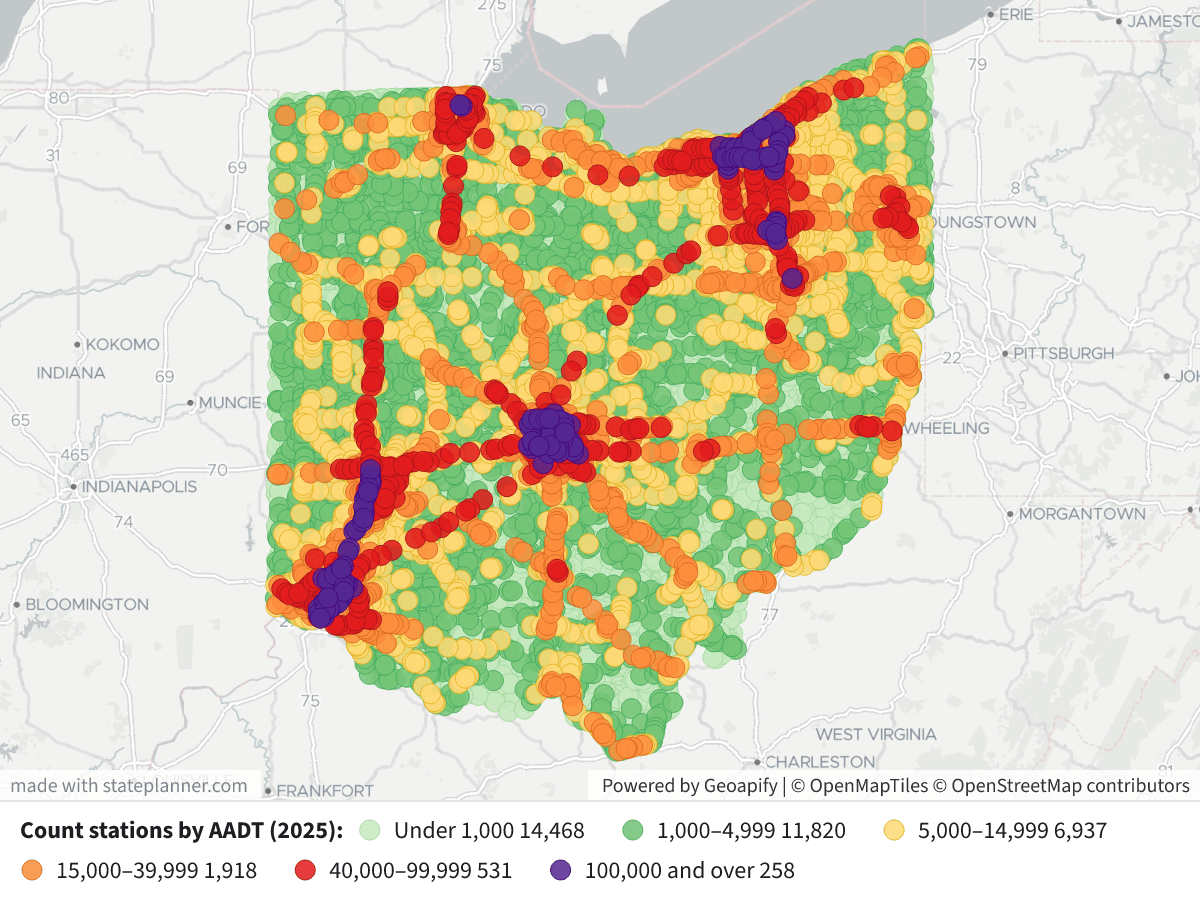
    The map shows 35,932 of ODOT's 37,108 traffic count stations. The other 1,176 have no AADT figure and are not drawn. Every station's AADT year is 2025. Busier stations are drawn on top of quieter ones.

    Legend: AADT, vehicles per day

    • Light green: under 1,000 (14,468 stations)
    • Green: 1,000–4,999 (11,820)
    • Yellow: 5,000–14,999 (6,937)
    • Orange: 15,000–39,999 (1,918)
    • Red: 40,000–99,999 (531)
    • Purple: 100,000 and over (258)

    What the data shows

    • Most stations count light traffic. The median station records about 1,670 vehicles a day, and three-quarters record under 5,400. Most of the short-term counts are on rural state routes and local roads.
    • The heaviest volumes are on the urban interstates. The purple and red points follow the freeways around and through Columbus, Cleveland, Cincinnati, Dayton, Toledo and Akron.
    • The busiest stations are on I‑270 in Franklin County. The top station records 195,362 vehicles a day, about 29,700 of them trucks. Next come I‑271 in Cuyahoga County (172,776) and I‑480 in Cuyahoga County (165,042).
    • Only 348 stations are permanent counters. The rest are short-term count locations, whose AADT ODOT estimates from counts taken over a few days.

    Click any point to see its station ID, county, route, AADT, the split between cars and trucks, and whether it is a permanent counter.

    I can also map AADT along each road segment using the Traffic Count Segments table, map truck AADT or truck share, or show only the permanent counters.

Layers

  • …
    • …
    • …
    • …
    • …
    • …
    • …

Click anything on the map for its details.

The transcript below the answer shows every query it ran. Shapefiles of every layer, at full detail, can be downloaded in State Planner: sign up to ask your own question and export any map.

Ask your own question about Ohio

Send takes you to sign up (every feature free for 7 days, no card needed), or to sign in if you have an account. Your question will be waiting in your new chat.

Transcript

What follows is the transcript of this chat as State Planner generated it. It is here to show how the answer above was arrived at: every query State Planner ran, what each one returned, and where the data came from.

transcript.md

↑ Contents

State Planner chat · https://stateplanner.com

  • State: Ohio (OH)
  • Started: October 29, 2026, 1:53 PM UTC
  • Runtime: 26 sec
  • Status: completed
Prompt

ODOT Traffic Count Stations by Annual Daily Traffic

Model: Anthropic: Claude Opus 5.5 (anthropic/claude-opus-5.5, via openrouter)

Response

ODOT traffic count stations by annual average daily traffic (AADT)
Traffic Count Stations by AADT

The map shows 35,932 of ODOT's 37,108 traffic count stations. The other 1,176 have no AADT figure and are not drawn. Every station's AADT year is 2025. Busier stations are drawn on top of quieter ones.

Legend: AADT, vehicles per day

  • Light green: under 1,000 (14,468 stations)
  • Green: 1,000–4,999 (11,820)
  • Yellow: 5,000–14,999 (6,937)
  • Orange: 15,000–39,999 (1,918)
  • Red: 40,000–99,999 (531)
  • Purple: 100,000 and over (258)

What the data shows

  • Most stations count light traffic. The median station records about 1,670 vehicles a day, and three-quarters record under 5,400. Most of the short-term counts are on rural state routes and local roads.
  • The heaviest volumes are on the urban interstates. The purple and red points follow the freeways around and through Columbus, Cleveland, Cincinnati, Dayton, Toledo and Akron.
  • The busiest stations are on I‑270 in Franklin County. The top station records 195,362 vehicles a day, about 29,700 of them trucks. Next come I‑271 in Cuyahoga County (172,776) and I‑480 in Cuyahoga County (165,042).
  • Only 348 stations are permanent counters. The rest are short-term count locations, whose AADT ODOT estimates from counts taken over a few days.

Click any point to see its station ID, county, route, AADT, the split between cars and trucks, and whether it is a permanent counter.

I can also map AADT along each road segment using the Traffic Count Segments table, map truck AADT or truck share, or show only the permanent counters.

Exploratory Queries
Query 1 — Profile AADT distribution, years, and permanent stations.
   SELECT count(*) n,
          count(aadt) n_aadt,
          min(aadt_year) y0,
          max(aadt_year) y1,
          percentile_cont(ARRAY[0.25, 0.5, 0.75, 0.9, 0.99]) WITHIN GROUP (
           ORDER BY aadt
          ) pct,
          max(aadt),
          sum((is_permanent = 'Yes')::int) perm,
          sum((aadt < 1000)::int) lt1k,
          sum((aadt BETWEEN 1000 AND 4999)::int) b5k,
          sum((aadt BETWEEN 5000 AND 14999)::int) b15k,
          sum((aadt BETWEEN 15000 AND 39999)::int) b40k,
          sum((aadt BETWEEN 40000 AND 99999)::int) b100k,
          sum((aadt >= 100000)::int) ge100k
     FROM oh_traffic_count_stations
nn_aadty0y1pctmaxpermlt1kb5kb15kb40kb100kge100k
371083593220252025[414,1668,5432,12374.900000000001,81898.42000000004]195362348144681182069371918531258

data/turn-1-query-1.csv

Query 2 — Find the busiest count stations.
   SELECT station_id_nbr,
          county_cd,
          route_type,
          route_nbr,
          aadt,
          aadt_trucks,
          is_permanent
     FROM oh_traffic_count_stations
    WHERE aadt IS NOT NULL
 ORDER BY aadt DESC
    LIMIT 8
station_id_nbrcounty_cdroute_typeroute_nbraadtaadt_trucksis_permanent
45125FRAIR0027019536229693Yes
45025FRAIR0027018695428418No
202018CUYIR0027117277617970No
44625FRAIR0027017264726244No
44525FRAIR0027017028025881No
132625FRAIR00270166795No
44725FRAIR0027016677625349Yes
45918CUYIR0048016504211057No

data/turn-1-query-2.csv

Map Layer Queries
Count stations by AADT (2025) — colored by "cls": Under 1,000 (#c7e9c0), 1,000–4,999 (#74c476), 5,000–14,999 (#fed976), 15,000–39,999 (#fd8d3c), 40,000–99,999 (#e31a1c), 100,000 and over (#54278f)
   SELECT geom,
          station_id_nbr AS "Station",
          county_cd AS "County",
          route_type || ' ' || ltrim(route_nbr, '0') AS "Route",
          aadt AS "AADT",
          aadt_cars AS "Cars",
          aadt_trucks AS "Trucks",
          aadt_year AS "Year",
          is_permanent AS "Permanent",
          CASE
                    WHEN aadt < 1000 THEN '1'
                    WHEN aadt < 5000 THEN '2'
                    WHEN aadt < 15000 THEN '3'
                    WHEN aadt < 40000 THEN '4'
                    WHEN aadt < 100000 THEN '5'
                    ELSE '6'
          END AS cls
     FROM oh_traffic_count_stations
    WHERE aadt IS NOT NULL
 ORDER BY aadt

Picture: maps/turn-1-count-stations-aadt.png

Used Data Sets

data/turn-1-query-1.csv

↑ Contents
nn_aadty0y1pctmaxpermlt1kb5kb15kb40kb100kge100k
371083593220252025[414,1668,5432,12374.900000000001,81898.42000000004]195362348144681182069371918531258

1 row.

data/turn-1-query-2.csv

↑ Contents
station_id_nbrcounty_cdroute_typeroute_nbraadtaadt_trucksis_permanent
45125FRAIR0027019536229693Yes
45025FRAIR0027018695428418No
202018CUYIR0027117277617970No
44625FRAIR0027017264726244No
44525FRAIR0027017028025881No
132625FRAIR00270166795No
44725FRAIR0027016677625349Yes
45918CUYIR0048016504211057No

8 rows.

provenance/oh_traffic_count_stations.md

↑ Contents

Provenance: oh_traffic_count_stations

This file describes how the rows in PostgreSQL table oh_traffic_count_stations were obtained from an external source: where they were fetched and how fields were renamed and typed. Field meanings are in the mapping table below.

Identity
Pipeline (TIMS family)

Ohio DOT TIMS publishes this layer on the TIMS data page. The catalog behind that page is GET https://tims.dot.state.oh.us/tims/api/glossary. Each entry names a MapServer layer URL.

Data is fetched as GeoJSON from that layer's REST query endpoint (where=1=1, outFields=*, outSR=4326, f=geojson), paginated with resultOffset / resultRecordCount. GeoJSON was chosen over the portal's CSV/SHP/GDB/KMZ exports because it keeps full attribute names, keeps geometry, and loads into PostGIS via ST_GeomFromGeoJSON.

Esri field names become lowercase snake_case PostgreSQL columns (non [a-z0-9_] → _). Dates stored as Esri epoch-milliseconds become timestamptz. Geometry is ST_SetSRID(ST_GeomFromGeoJSON(…), 4326), wrapped in ST_Multi when the table's stored type is Multi*. Esri shape-area / shape-length system fields are dropped.

The same MapServer query is used whenever the table is refreshed.

Field → column mapping
Source fieldColumnEsri typeDescription
STATION_ID_NBRstation_id_nbresriFieldTypeStringUnique Identifier for AADT Station
NLFIDnlfidesriFieldTypeStringPrimary key field that is the basis for identifying unique roadway segments in ODOT's graphic roadway network. The attribute is made up of seven components that describe administrative and other characteristics related to a route segment; Positions (1) - Jurisdiction, (2 thru 4) - County Code, (5 thru 6) - Route Type, (7 thru 11) - Route Number, (12) - Extension Code, (13) - Description Code, (14) - Direction Code; For further definitions of codes, please refer to the Roadway Information Manual
CTL_BEGIN_NBRctl_begin_nbresriFieldTypeDoubleGIS linear referencing information - location of Count Station
COUNTY_CDcounty_cdesriFieldTypeStringThe 3-letter code of the county within Ohio (88 counties total)
COUNT_SOURCEcount_sourceesriFieldTypeStringJurisdiction/organization count was taken for
IS_PERMANENTis_permanentesriFieldTypeStringYes - permanent station, No - short term count location
ROUTE_TYPEroute_typeesriFieldTypeStringTwo letter code indicating the basic transportation grouping or system that the route belongs to - third component of the NLFID
ROUTE_NBRroute_nbresriFieldTypeStringRoute number associated with the section of the route
AADT_YEARaadt_yearesriFieldTypeIntegerYear original data was collected.
AADTaadtesriFieldTypeInteger
AADT_CARSaadt_carsesriFieldTypeIntegerAnnual Average Daily Traffic for passenger type vehicles
AADT_TRUCKSaadt_trucksesriFieldTypeIntegerAnnual Average Daily Traffic for type BC trucks. (B=Buses C= Commercial Trucks)
AADT_SINGLE_TRUCKSaadt_single_trucksesriFieldTypeIntegerAnnual Average Daily Traffic for single-unit trucks. (A truck tractor unit pulling other such units in a saddle mount configuration will be considered one single-unit truck)
AADT_COMBO_TRUCKSaadt_combo_trucksesriFieldTypeIntegerAnnual Average Daily Traffic for Combination Trucks. (Combination vehicles are vehicles with a tractor and multiple trailers, often trailers of different sizes and layouts.)
K_FACTORk_factoresriFieldTypeDouble30th highest hourly volume of the year (out of 8,760 possible hours in a calendar year) expressed as a percentage of the AADT volume. K Factors (also known as Design Hour Volumes) are commonly used in highway project assessments and/or design concept reports.
D_FACTORd_factoresriFieldTypeDoubleD Factor is the percentage of traffic moving in the peak travel direction during the 30th highest hourly volume of the year. It is calculated by dividing the higher directional volume occurring in the 30th highest hour by the total roadway volume for that hour.
TRAFFIC_REPORTStraffic_reportsesriFieldTypeStringLink to corresponding traffic report
OBJECTIDobjectidesriFieldTypeOIDInternal feature number. [Esri]
(feature geometry)geomST_SetSRID(ST_GeomFromGeoJSON(…), 4326)Feature geometry, WGS84
Geometry
  • SRID 4326 (WGS84). GIST index on geom.
  • Empty / null geometries stored as SQL NULL.

© 2026 State Planner