
Ohio · September 26, 2026
MVRPC Fatal and Serious Injury Crashes 2021–2025
This is a real answer State Planner produced from Ohio’s public data.
Start for free to ask your own version of this question, or anything else about your state.
For the MVRPC metropolitan planning area around Dayton (the MVRPC polygon in the MPO data set, which covers Montgomery, Miami, Greene and the northern part of Warren County), count fatal and serious-injury crashes for each year from 2021 through 2025, counting each crash report once by its crash severity. Use the same scope as MVRPC's Safety Action Plan: leave out crashes on restricted-access freeways (functional class 1 and 2, which covers I-70, I-75, I-675 and the freeway sections of US 35 and SR 4), crashes on freeway ramps, and crashes with no location. Split each year into urban and rural, where urban means inside ODOT's Adjusted Urbanized Areas. Show one table with a row per year and columns for urban fatal, rural fatal, urban serious injury, rural serious injury, and total fatal plus serious injury. Then show a second table, by year, of the fatal and serious-injury crashes that the freeway and ramp exclusions removed. Map the counted crashes colored by severity, draw the excluded freeway crashes in gray, and outline the MVRPC boundary and the urbanized areas.
Fatal and serious-injury crashes in the MVRPC area, 2021–2025
How I counted:
- Area: crash points that fall inside the MVRPC polygon in the MPO data set.
- Severity: each crash report counted once, by its crash severity: Fatal (code 1) or Serious Injury Suspected (code 2). Every document number appears only once per year, so nothing was double-counted.
- Freeway exclusion: functional class 1 or 2.
- Ramp exclusion: ODOT crash location "On Ramp" (7) or "Off Ramp" (8).
- No location: none of the fatal or serious-injury crashes in these five years are missing coordinates, so this exclusion removed nothing. The mapped points also match the recorded latitude and longitude.
- Urban vs. rural: urban means inside any ODOT Adjusted Urbanized Area polygon. Inside MVRPC those are Dayton and Middletown, plus the smaller areas of Troy, Xenia, Piqua, Brookville, Germantown and New Carlisle.
Table 1: Counted crashes (freeways and ramps excluded)
Year Urban fatal Rural fatal Urban serious injury Rural serious injury Total fatal + serious injury 2021 61 13 324 64 462 2022 62 8 325 66 461 2023 50 11 336 49 446 2024 58 15 315 50 438 2025 57 13 347 50 467 2021–25 288 60 1,647 279 2,274 About 85% of the counted crashes are urban. The yearly total stays between 438 and 467, with no clear trend. Urban serious injuries reached their highest level in 2025 (347).
Table 2: Fatal and serious-injury crashes removed by the freeway and ramp exclusions
Year Freeway fatal Freeway serious injury Ramp fatal Ramp serious injury Total removed 2021 17 57 0 4 78 2022 19 52 1 1 73 2023 19 49 2 2 72 2024 10 54 2 4 70 2025 12 49 1 1 63 2021–25 77 261 6 12 356 - "Freeway" here means functional class 1 or 2 and not coded as a ramp. "Ramp" means any on-ramp or off-ramp crash; most of these also carry freeway functional class.
- Only 3 of the 18 ramp crashes were on roads that aren't class 1 or 2.
- Check: counted plus removed equals every fatal and serious-injury crash in the area (2,274 + 356 = 2,630).
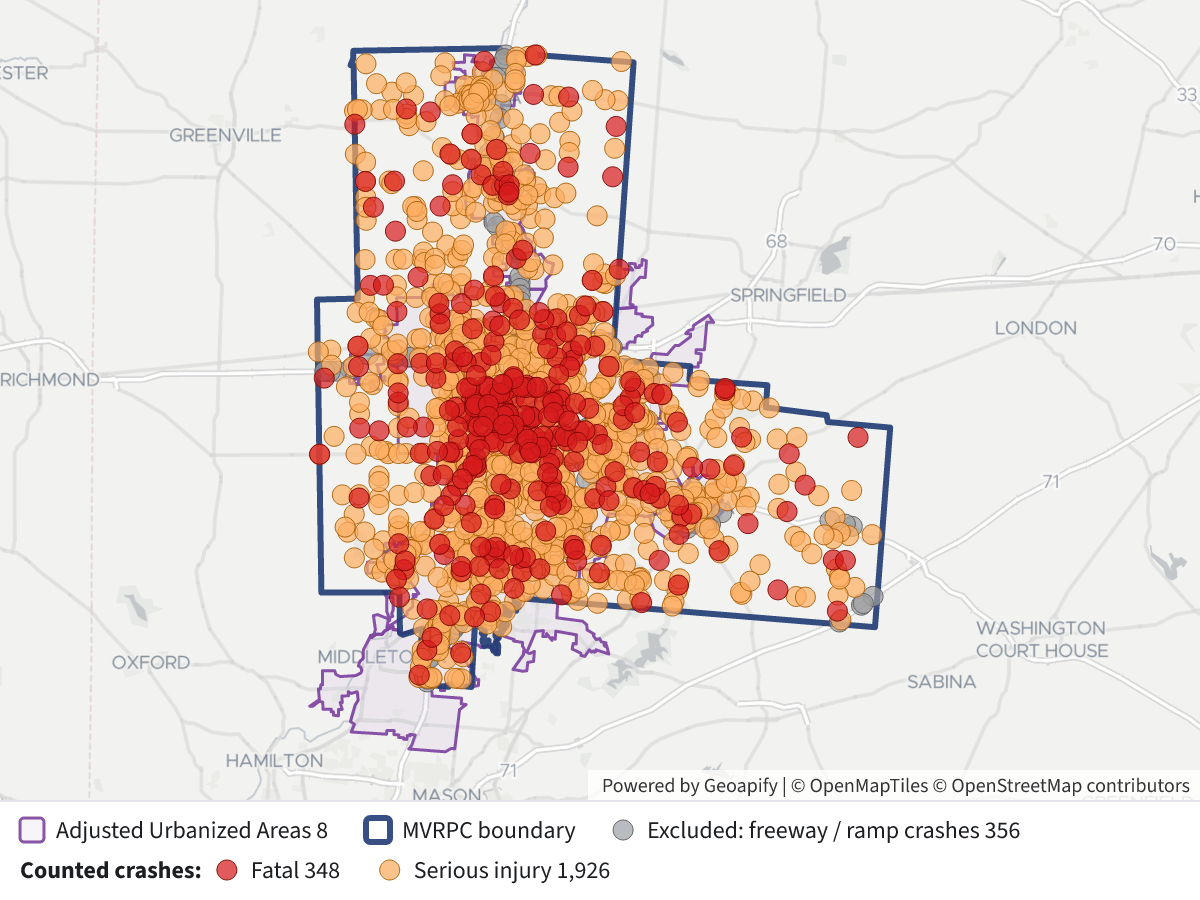 MVRPC Fatal and Serious Injury Crashes 2021–2025⬇ Image
Map legend
- Red dots: counted fatal crashes.
- Orange dots: counted serious-injury crashes.
- Gray dots: fatal and serious-injury crashes removed by the freeway and ramp exclusions.
- Dark blue outline: MVRPC boundary.
- Light purple polygons: ODOT Adjusted Urbanized Areas that fall within MVRPC.
Things to know
- Crashes with no functional class are counted. 34 crashes in the area have no functional class and no route ID. I kept them unless they were coded as ramps (one was). When I checked the nearest classified road, almost all sit on local roads, collectors or arterials. One (2023 report 20236098837) is about 60 m from I-70 and one (2022 report 20228117447) is about 100 m from a freeway ramp. If you treat those two as freeway crashes, each year's serious-injury count drops by at most one.
- Small urban areas count as urban. I included all the Adjusted Urbanized Area polygons, including the small ones like Troy and Xenia. If only the large urbanized areas (Dayton and Middletown) should count as urban, the crashes around those smaller towns would move to the rural columns.
- These numbers may not match MVRPC's plan exactly. They come from the current ODOT crash extracts, which are updated weekly; 2025 in particular may still be incomplete. The MVRPC plan may also have used a different crash snapshot or edge rules, such as how it handles the northern Warren County line.
Layers
- …
- …
- …
- …
- …
- …
Click anything on the map for its details.
The transcript is a Word document with every query the answer ran. Shapefiles of every layer, at full detail, can be downloaded in State Planner: sign up to ask your own question and export any map.