
Ohio · September 26, 2026
District 4 Pavement Selections: Optimized vs Worst-First
This is a real answer State Planner produced from Ohio’s public data.
Start for free to ask your own version of this question, or anything else about your state.
ODOT District 4 has $40 million to spend on state-system pavement next year. Choose which segments to treat to keep the most traffic off poor pavement, counting the benefit as the daily vehicle-miles on each segment that would move out of a PCR below 65. Assume a mill-and-fill costs $300,000 per lane-mile and fixes segments rated 55 to 64, and full-depth reconstruction costs $1.2 million per lane-mile and is the only fix below 55. Compare your selection with a worst-first list that spends the same budget on the lowest-rated pavement, report how many vehicle-miles each one fixes, and map both.
District 4 pavement: $40M optimized selection vs. worst-first
Bottom line: Choosing segments by traffic moves about 845,600 daily vehicle-miles off pavement rated below 65. Spending the same $40M worst-first moves about 151,700. That makes the optimized list roughly 5.6× more effective by your measure.
Optimized (most vehicle-miles) Worst-first (lowest PCR first) Segments funded 47 18 Spent $39.96M $39.94M Daily vehicle-miles lifted to PCR 65 or better 845,589 151,698 Centerline miles / lane-miles 58.2 / 133.2 13.8 / 35.1 Treatments 47 mill-and-fill, 0 reconstructions 15 reconstructions, 3 mill-and-fill Share of all poor-pavement vehicle-miles fixed 75% 14% Only 2 segments are on both lists: SR 43 in Portage County (PCR 55) and I-680 southbound, log 6.13–6.70 (PCR 56).
What's in scope: District 4 has 93 directional segments rated below 65, all rated in 2026. Treating all of them would cost $114.0M and would lift 1.12M daily vehicle-miles.
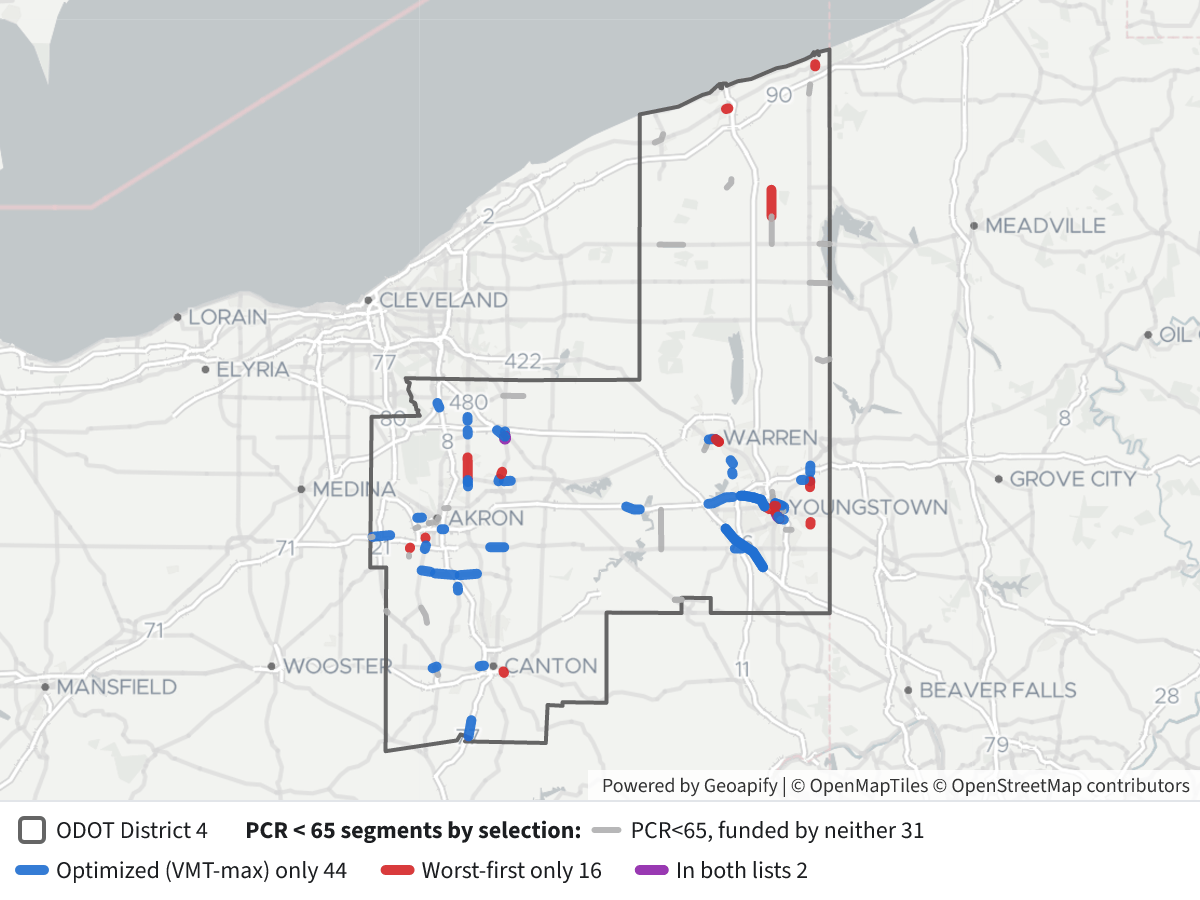 District 4 Pavement Selections: Optimized vs Worst-First⬇ Image
Map legend
- Blue: optimized list only.
- Red: worst-first list only.
- Purple: on both lists.
- Grey: rated below 65 but funded by neither list.
- Dark outline: District 4 boundary.
- Click any segment to see its route, log points, PCR and treatment.
Why the optimized list wins
Mill-and-fill costs a quarter as much per lane-mile as reconstruction. So each dollar goes about four times further on segments rated 55–64, and the optimizer puts its money on the busiest ones. It is heavily weighted to Mahoning County interstates:
- I-80 eastbound, Mahoning, log 0.54–3.97 (PCR 57): $3.1M, 95,800 vehicle-miles.
- I-76 (the K segment), Mahoning, both directions, log 4.3–11.6 (PCR 60 and 62): $8.7M, 162,500 vehicle-miles.
- I-680, Mahoning, both directions, log 2.12–4.12 (PCR 57 and 61): $2.4M, 82,000 vehicle-miles.
- Other large items:
- SR 14 in Portage: 39,200 vehicle-miles.
- I-77 in Stark: 37,500.
- I-76 in Portage: 29,300.
- US 224 in Portage: 26,700.
- Several stretches of SR 619 in Summit.
- I-76 in Summit at 102,000 AADT.
Why worst-first underperforms
Most of its money goes on expensive reconstructions of lightly used roads:
- SR 91 in Summit (PCR 51): $13.3M for 40,100 vehicle-miles.
- SR 193 in Ashtabula (PCR 48): $8.3M for only 2,800 vehicle-miles, at 800 AADT.
Its best item is I-680 southbound, log 4.12–6.13 (PCR 49, 52,000 AADT), which rebuilds for $4.8M.
The trade-off to weigh
The optimized list funds none of the 20 segments rated below 55. Those segments need $51.9M of reconstruction and carry about 165,000 daily vehicle-miles. They will keep getting worse, and they include I-680 southbound (PCR 49 and 53) and US 422 in Trumbull (PCR 46–47). A realistic program would probably set aside money for the worst reconstructions and fill the rest by vehicle-miles.
How I calculated it
- Data: the state pavement ratings table, District 4 only, segments rated below 65. Length comes from the log points. Rated 55–64 means mill-and-fill at $300,000 per lane-mile; below 55 means reconstruction at $1.2M per lane-mile.
- Divided highways: each direction is rated separately. The recorded lane count and traffic cover both directions, so I halved them for each directional segment. On 208 direction records the lanes and traffic were blank, so I filled them in from the other direction of the same route and log range. Every one had a match.
- Optimized list: the exact combination of segments that gives the most vehicle-miles within $40M, not a rule of thumb.
- Worst-first list: sorted by lowest PCR, with ties going to the busier segment. It funds each segment that still fits the remaining budget and skips any that doesn't. The first one skipped was SR 82 in Portage, a $6.4M reconstruction.
- Assumptions: every segment is treated in full at one uniform cost, with no partial treatments or bundling into projects, and nothing already programmed is excluded. The benefit uses current traffic and doesn't count the decline of pavement left untreated.
Layers
- …
- …
- …
- …
- …
- …
Click anything on the map for its details.
The transcript is a Word document with every query the answer ran. Shapefiles of every layer, at full detail, can be downloaded in State Planner: sign up to ask your own question and export any map.