
Pennsylvania · September 27, 2026
PA Freight Regions and Their Biggest Partners
This is a real answer State Planner produced from Pennsylvania’s public data.
Start for free to ask your own version of this question, or anything else about your state.
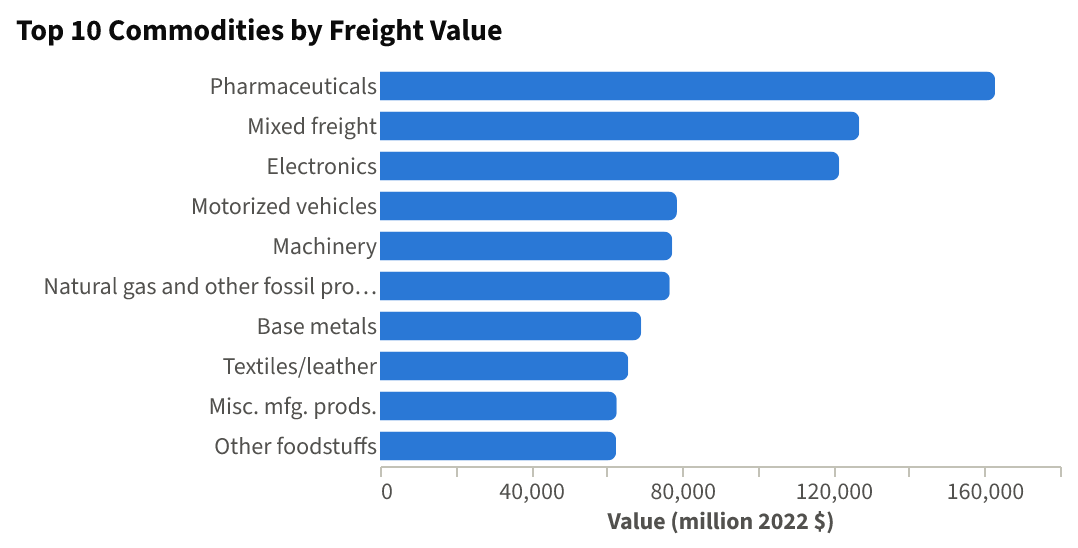
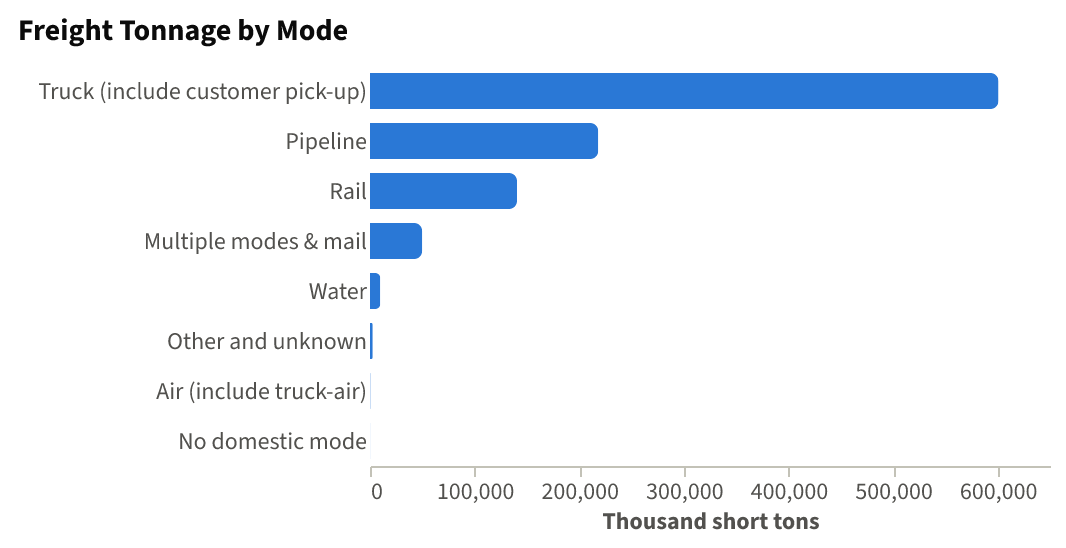
Map Pennsylvania's freight regions shaded by total freight value, and chart the top 10 commodities by value and the tonnage split by mode. Then draw lines to partner regions that send and receive the most.
I'll start by inspecting the freight tables.
Now let me explore the freight flows.
Now the maps. First, the four Pennsylvania freight regions shaded by total freight value.
Now the complete picture: the region choropleth plus two-way flow lines to the top partner regions.
Pennsylvania's 2022 Freight, by Region, Commodity, Mode and Partner
All figures are FAF6.0 (2022). Tonnage is thousand short tons; value is million 2022 constant dollars. FAF records shipment origin and destination between whole-county freight regions — it is not measured truck volume on any particular highway.
1. The four Pennsylvania freight regions
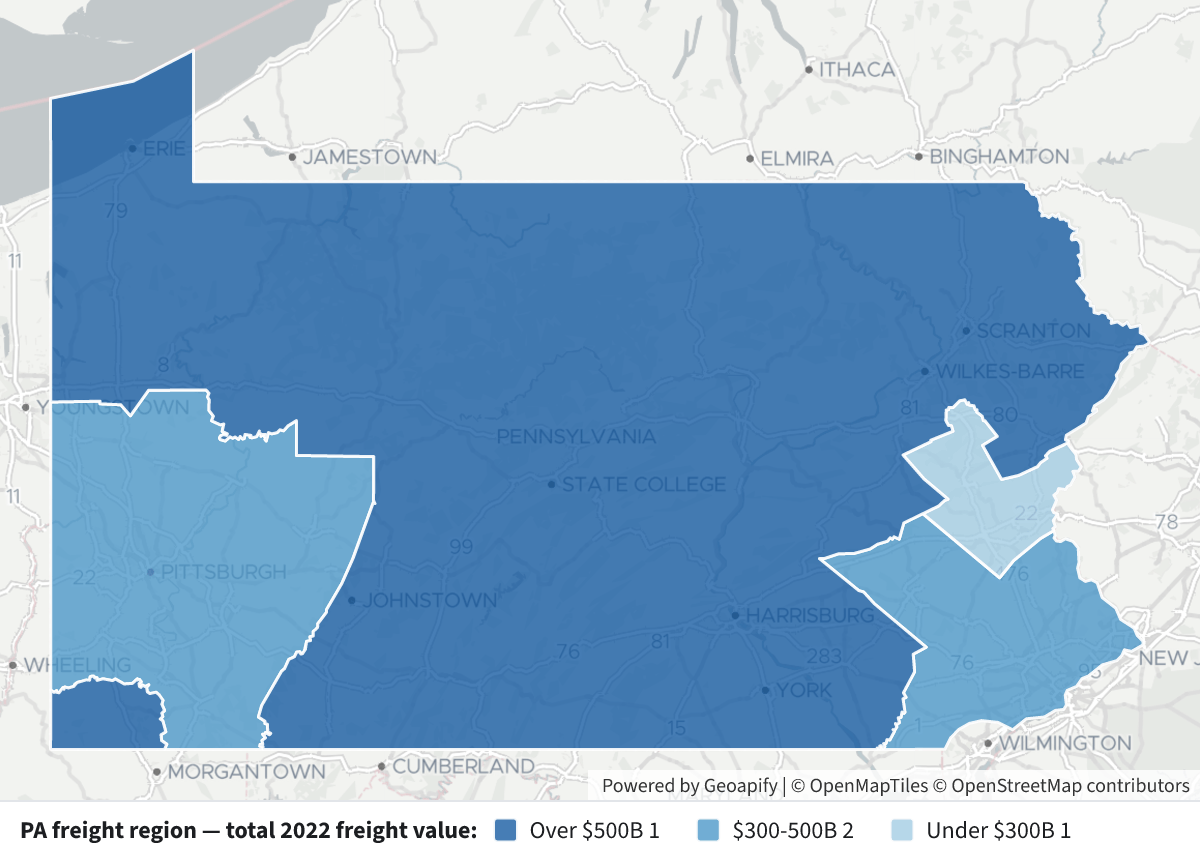
Pennsylvania is split into four FAF zones: Philadelphia (421), Pittsburgh (422), Allentown (423) and the remainder of the state (429). Harrisburg, Erie and Scranton are all in the remainder.
 Pennsylvania Freight Regions by Value⬇ Image
Map legend: each polygon is one FAF zone, shaded by total 2022 freight value with that zone as origin or destination — dark blue ≥$500B, medium $300–500B, light under $300B. Click a region for its value and tonnage.
FAF zone Region Freight value Tonnage 429 Rest of PA (incl. Harrisburg, Erie, Scranton) $759B 643 M tons 421 Philadelphia PA part $489B 301 M tons 422 Pittsburgh PA part $357B 424 M tons 423 Allentown PA part $153B 78 M tons Because a shipment with both endpoints in Pennsylvania counts in both zones, these four sum to $1.76T while the underlying PA-touching total is $1.41T of value and 1.02 billion short tons of freight — the difference is the intra-state flows counted twice.
2. What moves, and how
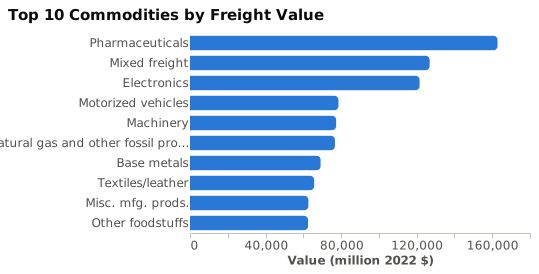
Pharmaceuticals lead by a wide margin ($163B) on a trivial tonnage (3.4 M tons) — the classic high-value/low-weight profile. Mixed freight ($127B) and electronics ($122B) follow, then motorized vehicles, machinery and natural gas & other fossil products. In tonnage terms the order is completely different: natural gas and other fossil products alone account for 222 M tons, and other foodstuffs 44 M tons, while pharmaceuticals barely register.
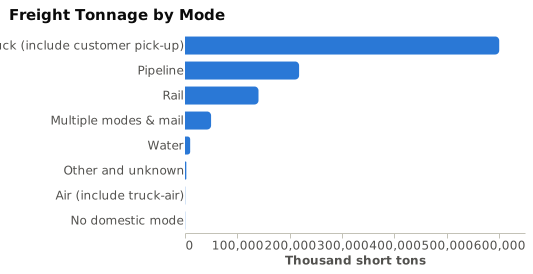
Trucking carries 600.7 M tons (59%) and $1.01T of the $1.41T value. Pipeline is second in tonnage (218 M tons) but only $83B of value, rail third (141 M tons, $46B). Multiple modes & mail is modest in tonnage (50 M tons) but high in value ($219B — this is where parcel and intermodal electronics/pharma move). Water (9.9 M tons), air (0.38 M tons but $31B) and the residual "no domestic mode" code complete the list.
3. Who Pennsylvania trades with
 PA Freight Regions and Their Biggest Partners⬇ Image
Map legend
- Blue polygons — the four Pennsylvania freight regions, shaded by total value (as above).
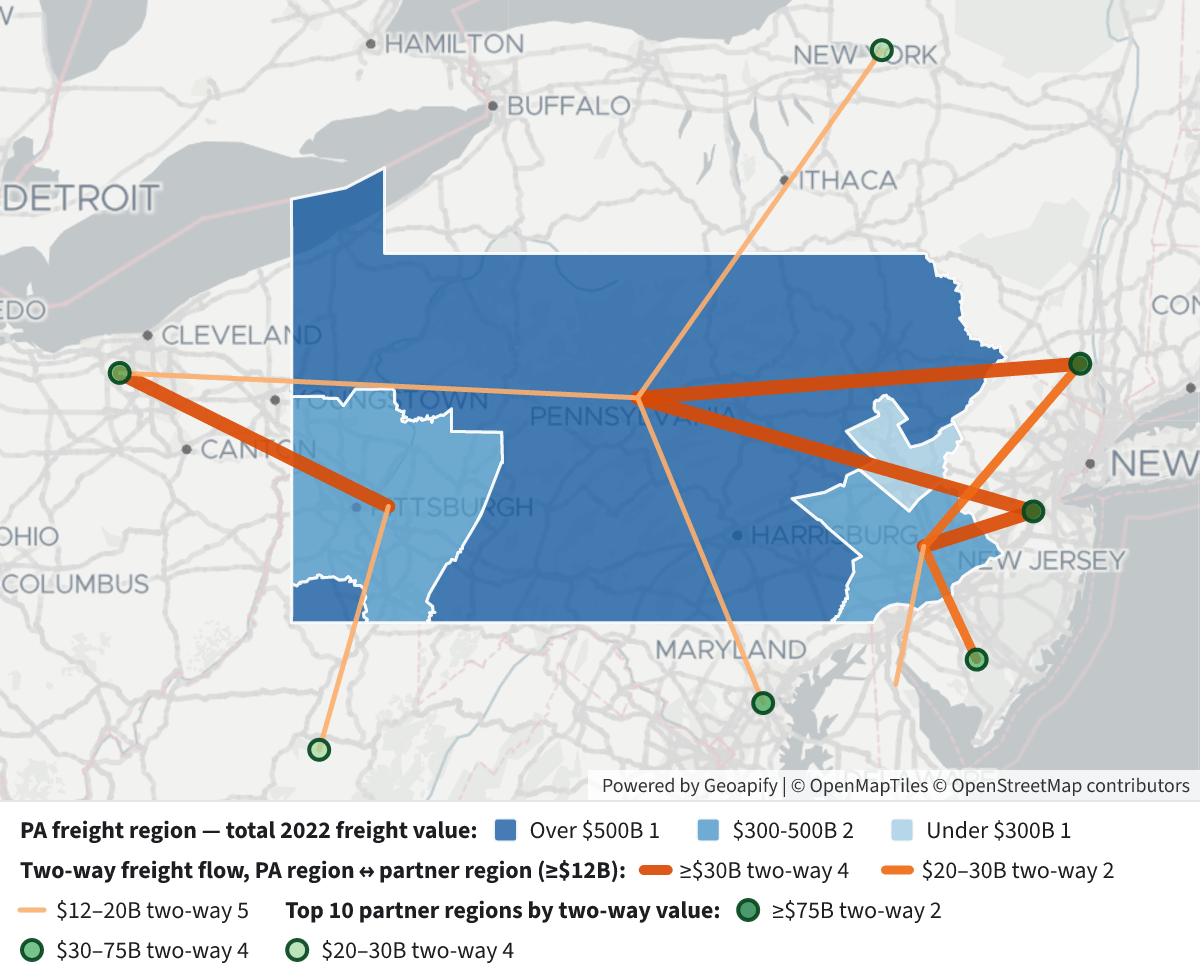
- Orange lines — every Pennsylvania-zone ↔ partner-zone pair with more than $12B of two-way freight; thicker/darker means bigger. Each line joins the two zone centroids and its popup splits the flow into "PA sends" and "PA receives".
- Green dots — the top 10 partner regions by two-way value; darker green is larger (≥$75B, $30–75B, $20–30B).
Partner region State PA → partner Partner → PA Two-way New York NY-NJ-CT-PA (NJ part) NJ $54.2B $56.8B $111.0B New York NY-NJ-CT-PA (NY part) NY $45.3B $33.8B $79.1B Cleveland OH OH $36.7B $14.0B $50.7B Philadelphia PA-NJ-DE-MD (NJ part) NJ $20.9B $25.9B $46.8B Los Angeles CA CA $9.8B $22.3B $32.1B Baltimore MD MD $18.2B $13.8B $32.0B Rest of NY NY $13.2B $14.9B $28.2B Chicago IL-IN-WI (IL part) IL $10.5B $15.9B $26.4B West Virginia WV $16.5B $9.5B $26.0B Boston MA-RI-NH-CT (MA part) MA $12.3B $12.2B $24.6B The biggest single lane is Rest of PA → the New Jersey part of the New York metro area, $28.1B; the single biggest inbound lane is NJ part of New York → Philadelphia, $24.5B. Note how lopsided some pairs are: Pittsburgh ships $36.7B to Cleveland but receives only $14.0B, while Los Angeles sends $22.3B into Pennsylvania against $9.8B going the other way. West Virginia stands out on tonnage rather than value — 26.5 M tons in and 36.1 M tons out, a coal-and-bulk relationship.
For completeness, Pennsylvania's overseas freight runs mostly through Europe ($65.7B, imports $44.5B), Eastern Asia ($39.3B, imports $32.4B) and Canada ($30.9B, nearly balanced). Those eight foreign regions carry no geometry in the data, so they cannot be drawn — they are reported here instead.
Caveats: for import records the "origin" is the U.S. port-of-entry region, not the true overseas origin, so a partner zone's inbound figure can include goods that only entered the country there. Consecutive FAF releases don't exist for this vintage (FAF6.0 is 2022 only), so nothing here is a trend.
Layers
- …
- …
- …
- …
- …
- …
- …
- …
- …
- …
- …
- …
Click anything on the map for its details.
The transcript is a Word document with every query the answer ran. Shapefiles of every layer, at full detail, can be downloaded in State Planner: sign up to ask your own question and export any map.