
Ohio · September 26, 2026
Eastgate Hazard-Exposed Structures and Routes
This is a real answer State Planner produced from Ohio’s public data.
Start for free to ask your own version of this question, or anything else about your state.
Map the structures and routes in the Eastgate area around Youngstown exposed to slope failure, scour and flooding, and show what traffic depends on each.
I'll start by finding the Eastgate boundary and checking the hazard and traffic tables.
Need parentheses around the DISTINCT ON subqueries.
Hazard-exposed structures and routes in the Eastgate region (Mahoning and Trumbull)
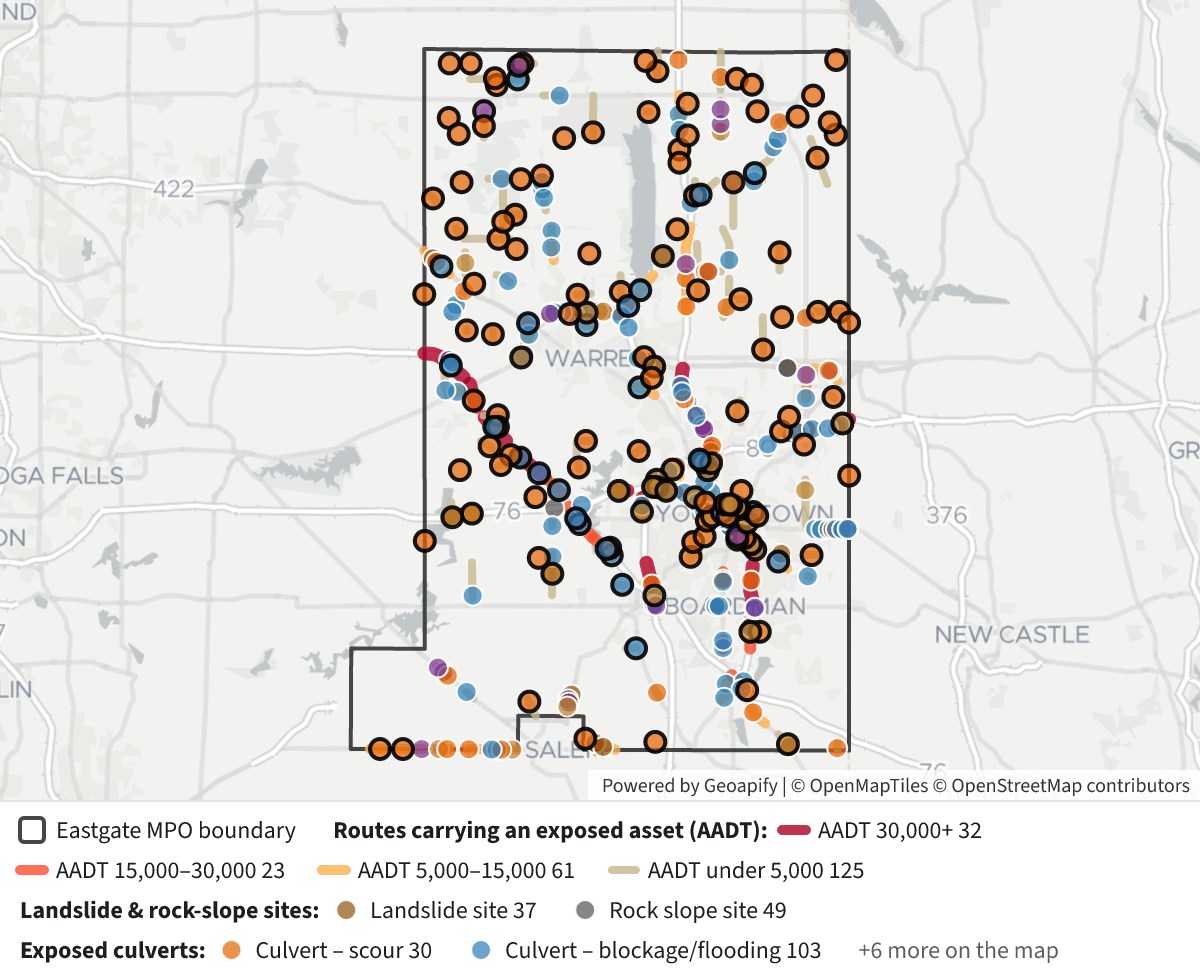 Eastgate Hazard-Exposed Structures and Routes⬇ Image
What I took "Eastgate area" to mean: the Eastgate Regional Council of Governments MPO boundary, which covers about 1,061 sq mi of Mahoning and Trumbull counties. Everything below was selected spatially inside that polygon.
How each hazard was flagged
The database has no FEMA floodplain layer. So "flooding" here comes from what inspectors recorded about each structure's waterway, not from mapped flood zones.
Hazard Bridges (1,310 in area) Culverts (3,146 ODOT culverts) Scour Scour code 4, 6, 7 or U (4 = stable but needs action, 6 = not yet evaluated, 7 = countermeasures installed, U = foundations unknown), or a scour or channel inspection rating of 4 or below → 98 Flagged scour-critical, or scour rating of 4 or below → 51 Flooding Waterway adequacy of 4 or below, which means the approaches or deck get overtopped often or with significant delays → 27 Waterway blockage rating of 4 or below → 117 Slope failure Within 150 m of an ODOT landslide or rock-slope site → 44 Embankment rating of 4 or below → 21 Any hazard 166 (3 have more than one) 164 The area also has 86 geohazard sites: 37 landslides and 49 rock slopes. No bridge carries scour code 0–3, the most severe scour-critical ratings.
What traffic depends on them
- Slope failure on the interstates. Rock cuts line I‑680 through Youngstown, and those segments carry 21,000–46,000 AADT. There are also landslide sites on:
- I‑80 in Mahoning County: about 60,000 AADT, about 16,600 of them trucks.
- I‑80 in Trumbull County: about 46,000 AADT and 14,100 trucks.
- SR 11: 31,000–43,000 AADT.
- Bridges near slope sites: SR 82 over SR 46 (47,280 ADT), I‑680 over Dewey Ave (40,201), I‑80 over Ohltown Rd (25,070 each direction) and SR 11 over Norquest Blvd (19,149).
- Flooding on the Ohio Turnpike. Several I‑80 and I‑76 Turnpike crossings over ditches and small runs are rated waterway adequacy 4, and they carry 21,000–37,000 ADT. Examples are SFN 7829434, SFN 7829795 over Duck Creek ditch, and SFN 5028973 over Morrison Run. Others at the same rating:
- SR 5 over a branch of Mosquito Creek (16,625 ADT).
- US 422 over Chocolate Run (13,795 ADT).
- Scour on bridges: SFN 7829701, the Turnpike over Laws Run, has a channel rating of 4 and 35,398 ADT. Trumbull County Road 329 over a stream (SFN 7835809) has a channel rating of 4 and 31,147 ADT, which is unusually high for a county road.
- Culverts under major roads: small pipes (12–24 inches) under I‑680 carry 41,000–52,000 AADT, and they have blockage ratings of 4. One of them, culvert 1804756, also has scour rated 3 and embankment rated 4. Culverts under SR 11 in Trumbull County (about 42,000–43,000 AADT) have blockage rated 3–4. On I‑80 in Trumbull, culvert 1872108 carries 38,958 AADT with 17,064 trucks, the heaviest truck exposure among the culverts.
- Higher-tier slope sites are on local and secondary routes:
- Tier 3 rock slope RS00004122, on a ramp with about 5,400 AADT.
- Tier 2 landslides on US 422 (about 13,500 AADT), SR 45 and a ramp.
Legend
- Black outline: Eastgate MPO boundary.
- Route lines: traffic-count segments that carry at least one exposed bridge, culvert or slope site, colored by AADT:
- dark red: 30,000 or more
- red-orange: 15,000–30,000
- amber: 5,000–15,000
- tan: under 5,000
- Bridges (black-rimmed dots) and culverts (white-rimmed dots) share one color scheme:
- orange: scour
- blue: flooding (overtopping or blockage)
- light brown: slope (near a slope site, or a poor embankment for culverts)
- purple: more than one hazard
- Brown dots are landslide sites and dark gray dots are rock-slope sites.
Click any feature for its ADT or AADT, trucks, detour length and the ratings behind its flag.
Caveats
- Bridge ADT is NBI item 29, the traffic on the route carried by the bridge. Culvert and slope traffic is the AADT on the traffic-count segment at the same route and milepost.
- The 150 m distance used to tie bridges to slope sites is my choice.
- Geohazard tiers are ODOT's own rating. Most sites here are Tier 1, and I haven't confirmed which way the scale runs, so check ODOT's geohazard guidance before reading higher tiers as higher risk.
- These tables have no parcel-level or FEMA flood-zone data. Adding either would need a different source.
Possible next steps: narrow to state-maintained assets only, add the waterway-adequacy 5 bridges (13 more with occasional overtopping), or rank assets by ADT × detour length to show where a closure would cost the most.
- Slope failure on the interstates. Rock cuts line I‑680 through Youngstown, and those segments carry 21,000–46,000 AADT. There are also landslide sites on:
Layers
- …
- …
- …
- …
- …
- …
- …
- …
- …
- …
- …
- …
- …
- …
- …
- …
- …
- …
- …
Click anything on the map for its details.
The transcript is a Word document with every query the answer ran. Shapefiles of every layer, at full detail, can be downloaded in State Planner: sign up to ask your own question and export any map.