
Ohio · September 26, 2026
State Highway Fatal & Serious-Injury Crash Rate 2021–2025
This is a real answer State Planner produced from Ohio’s public data.
Start for free to ask your own version of this question, or anything else about your state.
Color every state-highway segment by its fatal and serious-injury crash rate per 100 million vehicle miles over 2021–2025, in quintiles, and mark the worst 25 stretches on top.
I'll start by inspecting the crash and road tables.
Fatal and serious-injury (KA) crash rates on Ohio state highways, 2021–2025
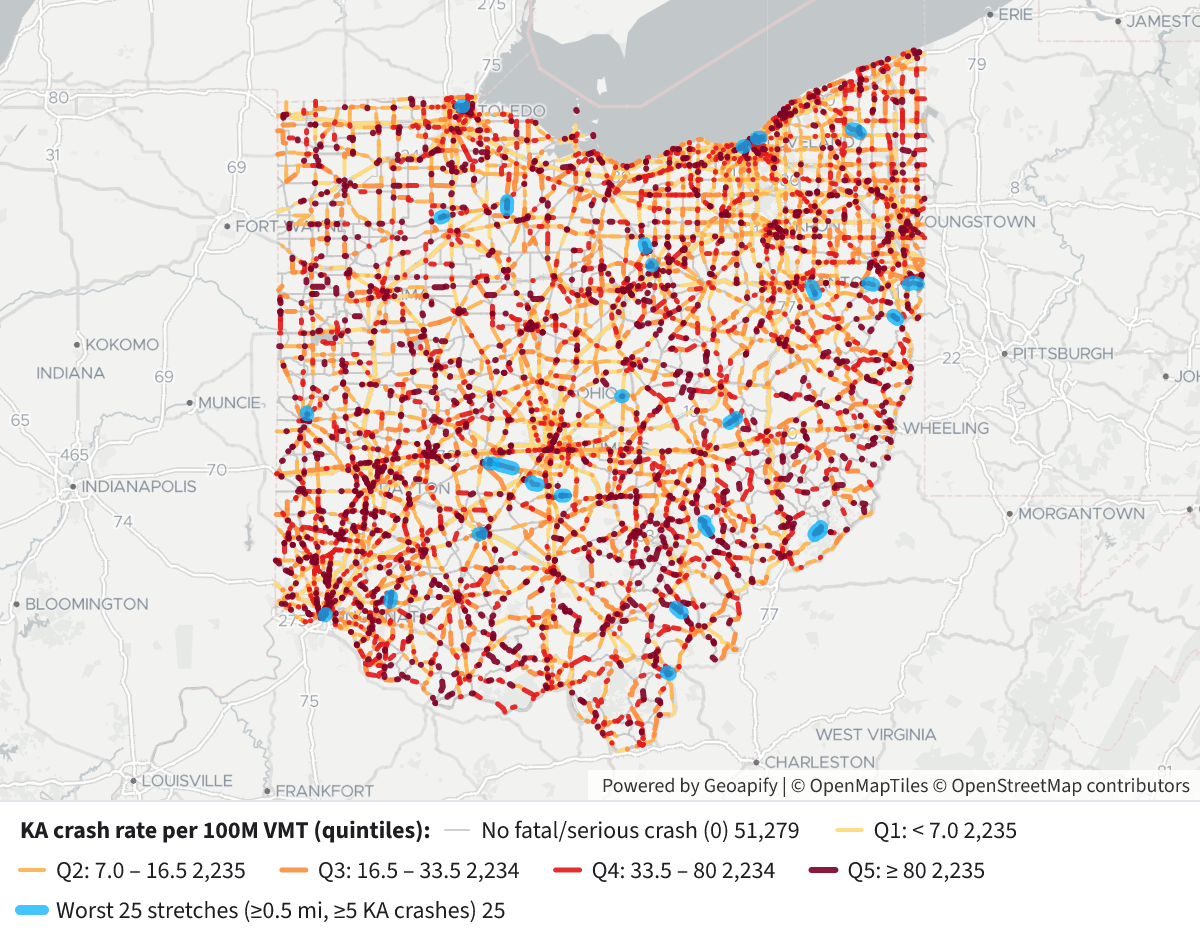 State Highway Fatal & Serious-Injury Crash Rate 2021–2025⬇ Image
Statewide numbers: 62,452 state-highway segments covering about 19,500 centerline miles. 17,628 fatal or serious-injury crashes were matched to them (99.8% of those on state routes), including 2,923 fatal crashes. Total travel was about 3,766 hundred million vehicle miles, so the average rate is 4.7 KA crashes per 100M VMT.
How I built it
- Segments: the Interstate, US and state route (IR/US/SR) sections in ODOT's Traffic Count Segments. Each section has one traffic count (AADT) and averages about 0.3 mi.
- Crashes: fatal and serious-injury crashes from 2021–2025. I placed each one on a segment using its route ID and mile point. Crashes in the opposite direction on divided highways were folded onto the main-direction segment.
- Rate: KA crashes ÷ (AADT × 365 × 5 × length ÷ 100,000,000).
- Quintiles: 82% of segments had no KA crash in five years. Quintiles over all segments would therefore all come out as 0. Instead, zero-crash segments are their own gray class, and the quintiles are drawn from the 11,173 segments with at least one KA crash.
Legend
Color KA rate per 100M VMT Light gray No fatal or serious crash Yellow (Q1) < 7.0 Light orange (Q2) 7.0 – 16.5 Orange (Q3) 16.5 – 33.5 Red (Q4) 33.5 – 80 Dark maroon (Q5) ≥ 80 Wide cyan band Worst 25 stretches Worst 25 stretches
A rate built from one crash on a 0.1-mile segment means very little. So I grouped consecutive segments on each route into stretches of about 1 mile, and ranked only stretches that are at least 0.5 mi long and had at least 5 KA crashes.
# Route County Log (mi) AADT KA (fatal) Rate 1 SR 555 Morgan 10.87–15.22 108 11 (1) 1,284 2 SR 143 Meigs 8.09–11.34 362 7 (0) 327 3 SR 93 Muskingum 27.61–30.99 550 8 (1) 236 4 SR 26 Washington 18.35–24.74 304 5 (0) 141 5 SR 665 Madison 2.48–3.75 1,660 5 (1) 131 6 SR 613 Hancock 9.04–10.38 1,594 5 (1) 129 7 SR 39 Columbiana 8.88–10.87 1,454 6 (2) 114 8 SR 60 Ashland 19.69–27.56* 1,684 5 (0) 114 9 SR 588 Gallia 10.35–11.60 2,317 6 (2) 113 10 SR 635 Seneca 2.34–5.15 975 5 (1) 100 11 SR 752 Pickaway 3.05–4.59 1,923 5 (0) 93 12 US 62 Licking 14.39–15.01 5,018 5 (0) 89 13 US 52 Hamilton 26.16–26.83 4,553 5 (1) 89 14 SR 133 Clermont 31.16–33.06 1,722 5 (1) 84 15 US 127 Darke 15.62–16.40 6,316 7 (2) 78 16 US 6 Cuyahoga 19.14–20.35 13,269 22 (4) 75 17 SR 44 Stark 4.69–7.81 1,193 5 (1) 74 18 SR 665 Madison 6.15–11.12 1,660 11 (1) 73 19 SR 154 Columbiana 9.64–13.23 1,538 7 (0) 69 20 SR 762 Pickaway 3.02–5.85 1,428 5 (0) 68 21 US 22 Fayette 6.05–7.00 5,989 7 (0) 67 22 SR 10 Cuyahoga 14.50–15.23 9,321 8 (1) 64 23 SR 86 Ashtabula 0.00–3.32 1,551 6 (1) 64 24 SR 172 Columbiana 10.76–12.65 2,285 5 (0) 64 25 SR 120 Lucas 15.03–15.72 11,632 9 (0) 61 *The SR 60 stretch spans a gap in the route (it leaves and rejoins), so it covers only 1.43 mi of road.
How to read this
- Rate rankings favor low-traffic rural roads. SR 555 in Morgan County ("Triple Nickel"), SR 26 in Washington County and SR 93 are known for heavy recreational and motorcycle use. Their tiny AADT (108 on SR 555) turns a handful of crashes into huge rates. Holiday or weekend traffic on these roads may be undercounted, which would inflate the rate further.
- Urban stretches have many more crashes behind their rates. US 6 in Cuyahoga County (22 KA crashes, 4 fatal), SR 10 and SR 120 are high-volume corridors. Their rates rest on far more crashes, which makes them the steadier findings.
- One AADT for all five years. The traffic data holds only 2025 counts, so they are applied to every year.
- Ramps and local roads are excluded. Crashes coded to ramps or to local routes that cross state highways are not counted.
Other ways to do this: use a smoothing method (such as empirical Bayes) or excess expected crashes, which would lower the weight of low-volume roads; rank by crash density (per mile) instead of rate; or change the stretch length and minimum crash count.
Layers
- …
- …
- …
- …
- …
- …
- …
- …
Click anything on the map for its details.
The transcript is a Word document with every query the answer ran. Shapefiles of every layer, at full detail, can be downloaded in State Planner: sign up to ask your own question and export any map.