
Ohio · September 26, 2026
Commute Flows Into Top Job-Surplus Block Groups
This is a real answer State Planner produced from Ohio’s public data.
Start for free to ask your own version of this question, or anything else about your state.
Find the ten block groups with the largest excess of jobs over resident workers and draw the commute flows feeding each one, weighted by worker count.
The ten block groups with the most jobs relative to resident workers (LODES 2023)
I compared jobs located in each block group (WAC) with employed people who live there (RAC). Both counts use primary jobs (JT01), which roughly equals one per worker, so the comparison is like-for-like. The commute flows come from LODES Origin-Destination for 2023 on the same basis.
# Block group Area Main sector Jobs Resident workers Excess 1 390490030004 Downtown Columbus (north) Finance 44,018 897 43,121 2 390351972001 Cleveland Clinic main campus Health care (40.4k) 42,276 0 42,276 3 390490011212 Ohio State University campus Education (36.2k) 36,317 546 35,771 4 390351077011 Downtown Cleveland Finance 35,771 1,396 34,375 5 390490101001 Northeast Columbus (Easton area) Finance 31,253 647 30,606 6 390610032001 Cincinnati Uptown medical district Health care 29,134 424 28,710 7 390351841042 Solon Manufacturing 21,283 405 20,878 8 390351561011 Independence Administrative/support 20,510 765 19,745 9 390852065002 Mentor Manufacturing 20,171 826 19,345 10 390490040022 Downtown Columbus (south, state government) Public administration 20,499 1,209 19,290 The area names are my own descriptions, based on the city each block group falls in and its dominant industry.
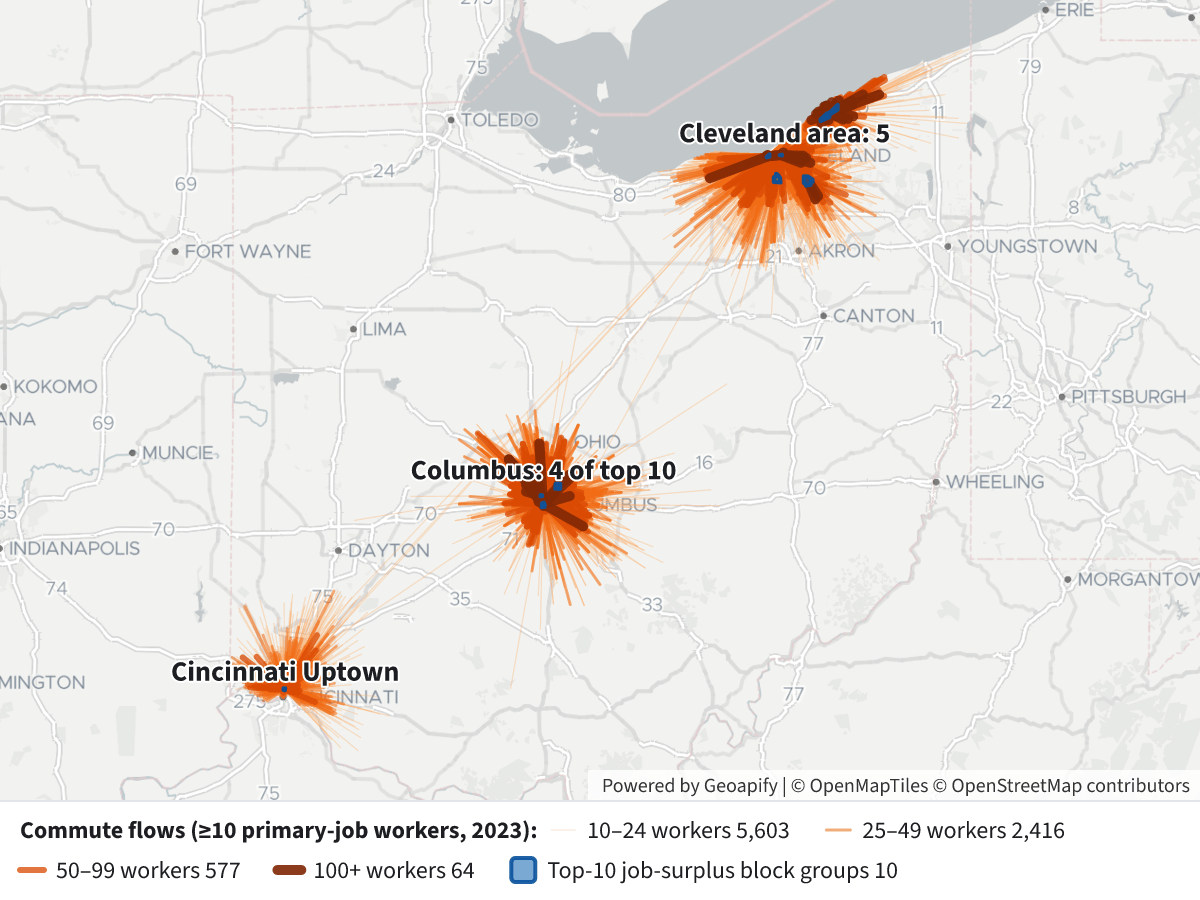 Commute Flows Into Top Job-Surplus Block Groups⬇ Image
Map legend
-
Blue polygons: the ten block groups with the biggest job surplus. Click one for its counts.
-
Orange-to-brown lines: commute flows from home block group to workplace block group. Thicker, darker lines carry more workers:
- pale orange, thin: 10–24 workers
- orange: 25–49
- dark orange: 50–99
- brown, thick: 100 or more
Click a line for its destination, home block group and worker count.
What the flows show
- Columbus (4 of the top 10) draws workers from across Franklin County and the surrounding counties. The two downtown block groups and the OSU campus have overlapping commute areas.
- Cleveland area (5 of the top 10) splits in two. The Clinic and downtown pull from the whole region. Solon, Independence and Mentor draw more from the suburbs and from Lake, Summit and Geauga counties.
- Cincinnati Uptown has the widest out-of-state draw by far. About 4,765 of its 29,134 workers (16%) live outside Ohio, mostly in Kentucky and Indiana. For every other top-10 site, out-of-state commuters are only about 1–4% of jobs.
What the map leaves out
- Small flows: only home-to-work pairs with at least 10 workers are drawn (8,660 lines). That covers about 70% of commuters into Columbus and Cleveland's downtowns, the Clinic, OSU and Cincinnati Uptown, and only about 37% into Independence, which draws from many scattered neighbourhoods. Mapping all ~48,000 pairs would bury the pattern.
- Out-of-state homes: these commuters appear in the counts above but not on the map, because their home locations have no Ohio block-group geometry.
- People living and working in the same block group: also not drawn.
- Lines are straight "desire lines" between block-group centres, not actual routes driven.
Why these places rank so high
- LODES counts a job where the employer's payroll office or site is registered (its unemployment-insurance record). A large employer that reports all its staff at one address can inflate a single block group's count, which may partly explain the finance-heavy block groups.
- Rankings by raw excess favour big job centres. Ranking by the ratio of jobs to resident workers, using all jobs (JT00), or using another year would give a somewhat different list. I can run any of those.
-
Layers
- …
- …
- …
- …
- …
- …
Click anything on the map for its details.
The transcript is a Word document with every query the answer ran. Shapefiles of every layer, at full detail, can be downloaded in State Planner: sign up to ask your own question and export any map.