
Ohio · September 26, 2026
MORPC Fatal and Serious Injury Crashes 2021–2025
This is a real answer State Planner produced from Ohio’s public data.
Start for free to ask your own version of this question, or anything else about your state.
For the MORPC area around Columbus, compute fatalities, serious injuries, each as a count and as a rate per 100 million vehicle miles, and non-motorized fatalities and serious injuries, for each of the last five years, and map where they fall.
I'll start by inspecting the relevant tables.
Now the VMT denominator, clipped to the MORPC boundary, with a conservative fill-in for uncounted local roads.
MORPC safety measures, 2021–2025
Area: the MORPC MPO planning boundary (about 1,188 sq mi, centred on Franklin County). A crash is counted if its mapped location falls inside that polygon.
Results
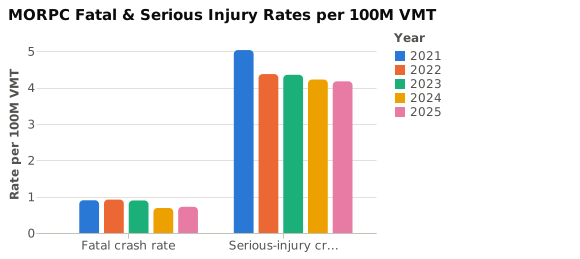
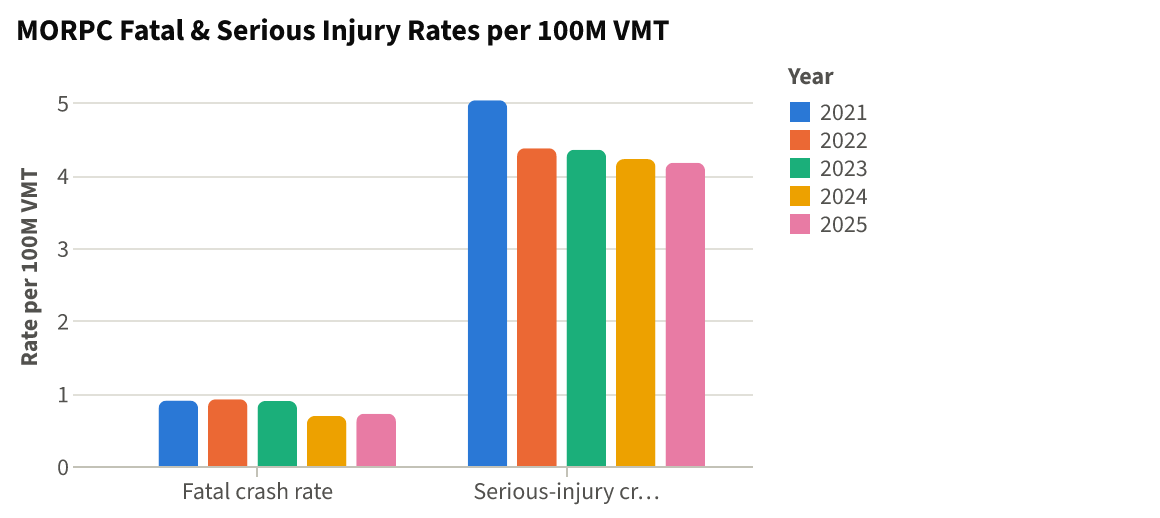
Year Fatal Fatal rate* Serious injury Serious-injury rate* Non-motorized fatal Non-motorized serious Non-motorized total 2021 140 0.90 783 5.03 39 130 169 2022 143 0.92 680 4.37 37 110 147 2023 139 0.89 676 4.35 32 140 172 2024 107 0.69 656 4.22 24 143 167 2025 112 0.72 649 4.17 33 154 187 5-yr avg 128.2 0.82 688.8 4.43 33.0 135.4 168.4 *Per 100 million vehicle miles traveled (VMT), using about 155.6 hundred-million VMT a year (see the VMT notes below).
- Fatal crashes held at about 140 a year for 2021–2023, then fell about 23% to 107–112 in 2024–2025.
- Serious-injury crashes fell about 17%, from 783 to 649, with most of the drop between 2021 and 2022.
- Pedestrian and bicycle crashes go the other way. Fatal plus serious rose to 187 in 2025, the highest of the five years. Serious injuries on foot or bike grew from 110 to 154. These crashes are now about 25% of all fatal and serious crashes, up from 18% in 2021.
- Pedestrians make up most of it (126–146 fatal/serious crashes a year). Bicycle crashes ran 21–41 a year, peaking in 2025.
Map
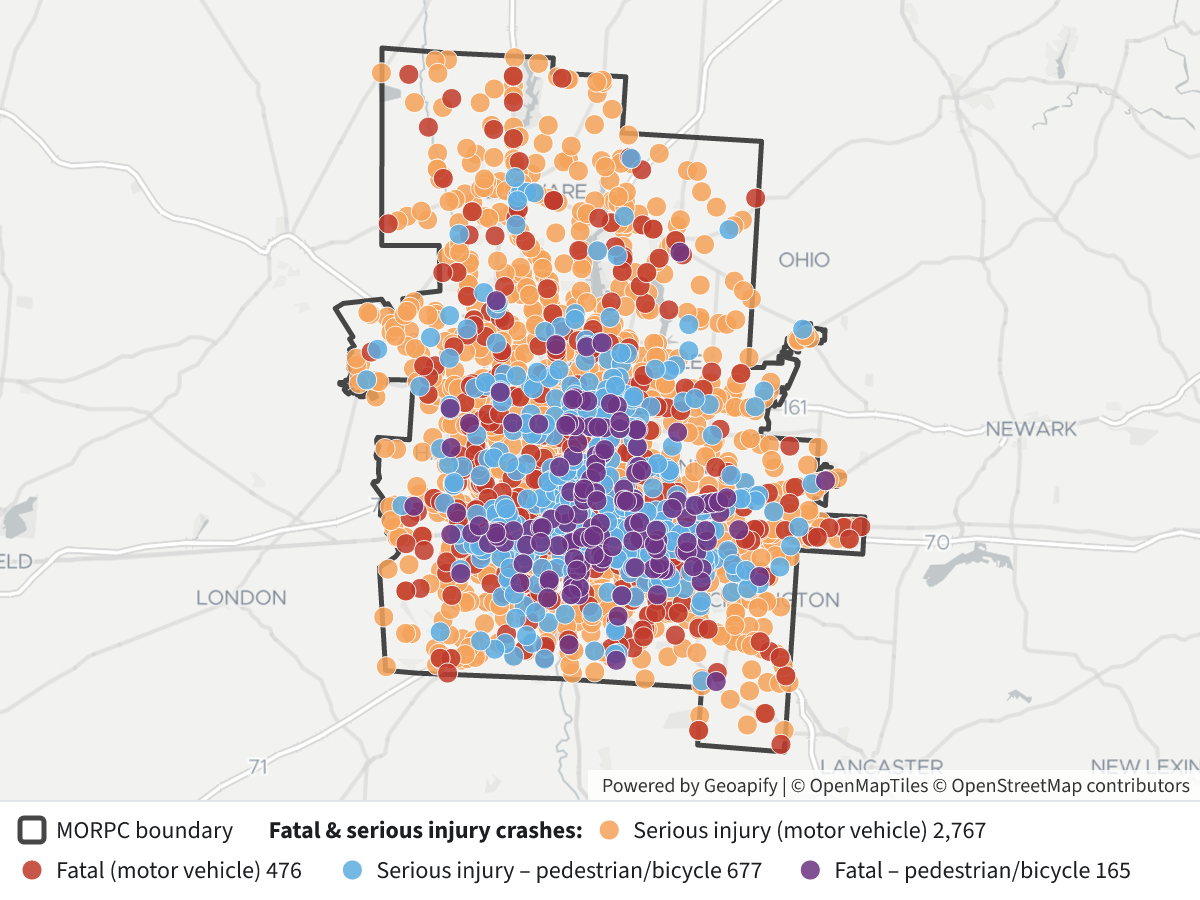 MORPC Fatal and Serious Injury Crashes 2021–2025⬇ Image
Legend:
- Black outline: MORPC boundary.
- Red: fatal crash involving motor vehicles only.
- Orange: serious-injury crash involving motor vehicles only.
- Purple: fatal crash involving a pedestrian or cyclist.
- Light blue: serious-injury crash involving a pedestrian or cyclist.
There are 4,085 crashes on the map, all five years together. Click any point for its year, severity, crash type and report number. Pedestrian and cyclist crashes cluster in central Columbus and along its main arterials. Motor-vehicle fatal crashes are spread more evenly, including the freeways and the rural edges of the region.
Caveats
- These are crash counts, not people. The crash data has one row per crash and records only the worst injury in each. So "fatalities" means fatal crashes, and a crash that killed two people counts once. "Serious injuries" means crashes whose worst injury was serious. The true numbers of people killed and seriously hurt, which is how the federal safety measures are defined, will be somewhat higher. Crash reports with person-level detail are needed for exact figures.
- "Non-motorized" is based on crash type. It counts crashes ODOT typed as Pedestrian or Pedalcycles (bicycles). A pedestrian hurt in a crash typed some other way, such as a vehicle leaving the road and hitting someone on the sidewalk, is left out.
- VMT comes from one year and is applied to all five. The only traffic volumes available are 2025 estimates, so every year uses the same mileage. That means the rate trend mirrors the count trend; it doesn't account for changes in how much people drove. I estimated VMT from road-inventory traffic counts, cut to the MPO boundary, without double-counting overlapping routes or the opposite direction of divided highways. That gives 40.8 million miles a day from counted roads.
- About 4,200 miles of local roads and collectors have no traffic count. I filled those in at low assumed volumes: 400 vehicles a day on local roads, 1,500 on minor collectors and 2,800 on major collectors.
- That brings the total to 42.6 million miles a day, or about 15.6 billion a year.
- Using counted roads only would make every rate about 4% higher: for example, 0.94 instead of 0.90 for 2021 fatal crashes.
- 2025 data may still change. It runs through December but the file is updated weekly, so late reports can still arrive.
If you need exact person counts or per-year VMT, you'll need ODOT's person-level crash records and HPMS mileage figures by year; neither is in this database. I can also split these numbers by county, road type or corridor.
Layers
- …
- …
- …
- …
- …
- …
Click anything on the map for its details.
The transcript is a Word document with every query the answer ran. Shapefiles of every layer, at full detail, can be downloaded in State Planner: sign up to ask your own question and export any map.