
Ohio · September 26, 2026
OKI NHS Bridge Condition by Deck Area
This is a real answer State Planner produced from Ohio’s public data.
Start for free to ask your own version of this question, or anything else about your state.
What share of NHS bridge deck area in the OKI region around Cincinnati is good and what share is poor by NBI rating, and which of the poor structures carry the most traffic?
Now compute the FHWA Good/Fair/Poor classification (lowest of deck, superstructure, substructure; culvert rating for culverts), weighted by deck area.
NHS bridge condition in the OKI region, weighted by deck area
Scope: I counted bridges that ODOT codes to the OKI MPO (MPO code 09, the Ohio side of OKI: Hamilton, Butler, Warren and Clermont counties). Each one carries a National Highway System route (NBI item 104 = 1), meets the NBIS minimum bridge length, and is an "on" record. That comes to 459 structures and about 8.49 million sq ft of deck.
Method: I used the FHWA performance-measure rule. Each bridge is rated by its lowest NBI component rating: deck, superstructure or substructure, or the culvert rating (item 62) for culverts. A lowest rating of 7 or higher is Good, 4 or lower is Poor, and 5–6 is Fair.
Condition Bridges Deck area (sq ft) Share of deck area Share of bridges Good 297 4,730,148 55.7% 64.7% Fair 156 3,650,056 43.0% 34.0% Poor 6 113,087 1.3% 1.3% Only 1.3% of NHS deck area is Poor, well below the federal 10% poor-deck-area penalty threshold. The more notable figure is the Fair share: 43% of deck area, much higher than its 34% share of bridges. Large structures are more likely to be Fair, so a lot of the region's deck area is one rating drop away from Poor.
The six Poor structures, by traffic (NBI item 29 ADT)
# SFN Carries / crosses Location ADT Deck (sq ft) Rating that makes it Poor 1 8303509 I-75 NB ramp over Dick's Creek (culvert) Warren Co., just south of SR 122 91,260 1,524 Culvert = 4 2 3113590 EB I-275 over Loveland Rd / railroad Hamilton Co., 2.6 mi east of US 22 35,701 25,225 Superstructure = 4 3 3113566 WB I-275 over Loveland Rd / railroad same location, twin structure 35,701 19,438 Superstructure = 4 4 3115909 WB I-275 over Norfolk Southern RR and US 50 Hamilton Co. 15,977 16,657 Superstructure = 4 5 3116069 I-275 over Whitewater River Hamilton Co., 3.1 mi east of the Indiana line 15,977 25,207 Superstructure = 4 6 3116077 I-275 over Whitewater River (twin) same location 15,977 25,036 Superstructure = 4 What stands out:
- The I-75 ramp culvert at Dick's Creek has the most traffic. It's small, but its 91k ADT is almost certainly the traffic on the I-75 route it's recorded against, not what the ramp itself carries. Its future-traffic forecast is 127k.
- The I-275 twin bridges at Loveland Rd are the biggest Poor exposure. Both directions are rated Poor, each carries about 35.7k ADT, and together they make up about 45k sq ft of the 113k sq ft Poor total.
- All five I-275 bridges are Poor for the same reason: superstructure = 4. Their decks rate 6–7 and their substructures 6–7. They were built in 1970–76, and all are ODOT-maintained and open without restrictions.
- The three I-275 bridges on Cincinnati's west side (Whitewater River and US 50 / railroad) sit together and carry about 16k ADT each. They could be packaged as one corridor project.
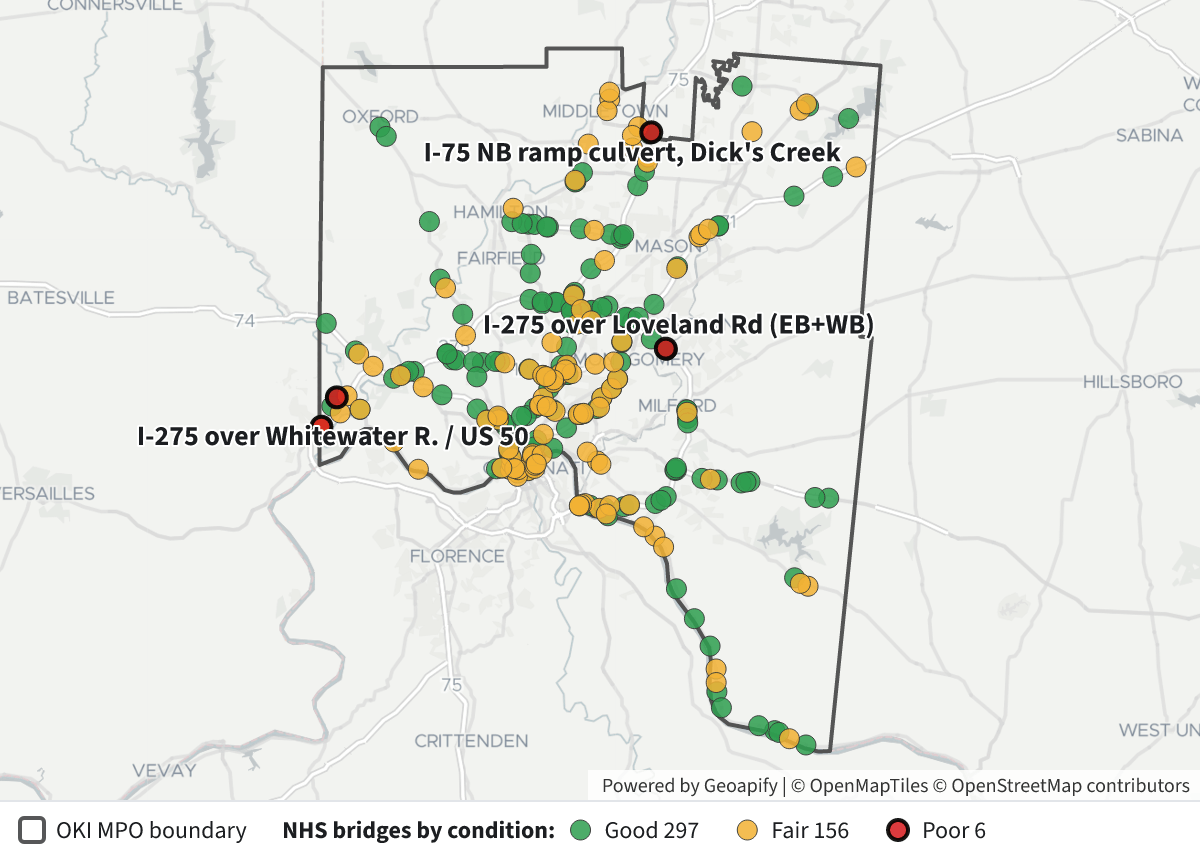 OKI NHS Bridge Condition by Deck Area⬇ Image
Map legend:
- Grey outline: the OKI MPO boundary.
- Points: NHS bridges, coloured by condition. Green is Good, amber is Fair, and red with a heavy outline is Poor.
- Click any point to see its SFN, route, lowest rating, deck area and ADT.
Caveats:
- What's left out: Kentucky and Indiana bridges in the OKI region aren't in this Ohio inventory. Border bridges that Kentucky maintains, such as the Ohio River crossings, may also be missing or only partly included.
- Boundary choice: Using the MPO polygon instead of the MPO code gives 556 rather than 566 NHS records before filtering. That's a small difference.
- Next steps: I can list the Fair structures rated 5 that are close to becoming Poor, or check which Poor bridges already have projects in the STIP or the next-4-years program.
Layers
- …
- …
- …
- …
- …
Click anything on the map for its details.
The transcript is a Word document with every query the answer ran. Shapefiles of every layer, at full detail, can be downloaded in State Planner: sign up to ask your own question and export any map.